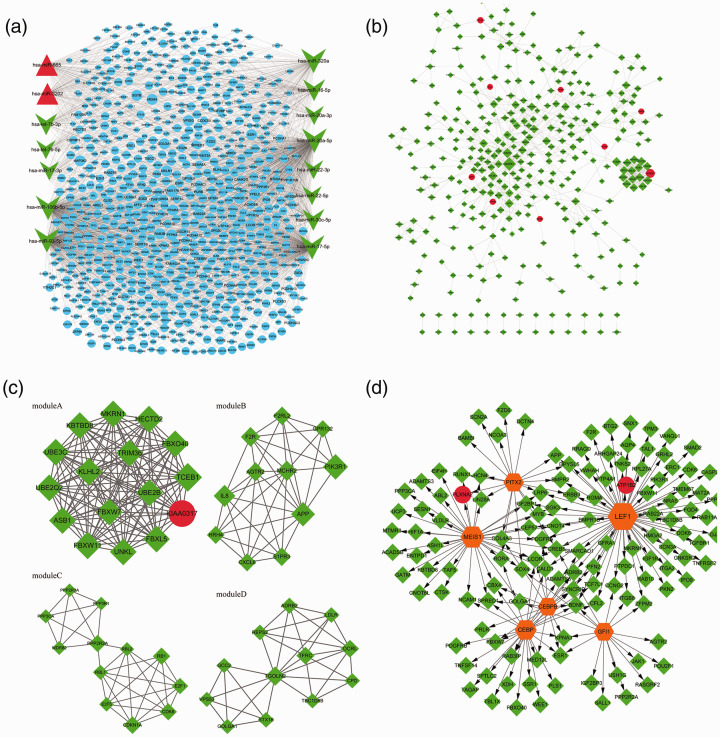
Fig. 1.
The miRNA-target regulatory network. Red triangles, green arrows, and blue circles represent up-regulated miRNAs, down-regulated miRNAs, and target genes, respectively (a); the protein–protein interaction network. Red circles and green diamonds represent the target genes of up-regulated miRNAs and down-regulated miRNAs, respectively. The higher the degree of a node, the larger the node is (b). The modules (a), (b), (c), and (d) identified from the protein–protein interaction network. Red circles and green diamonds represent the target genes of up-regulated miRNAs and down-regulated miRNAs, respectively. The higher the degree of a node, the larger the node is (c). The transcription factor (TF)-target regulatory network. Red circles and green diamonds represent the target genes of up-regulated miRNAs and down-regulated miRNAs, respectively. Orange hexagons stand for TFs. The higher the degree of a node, the larger the node is (d).

