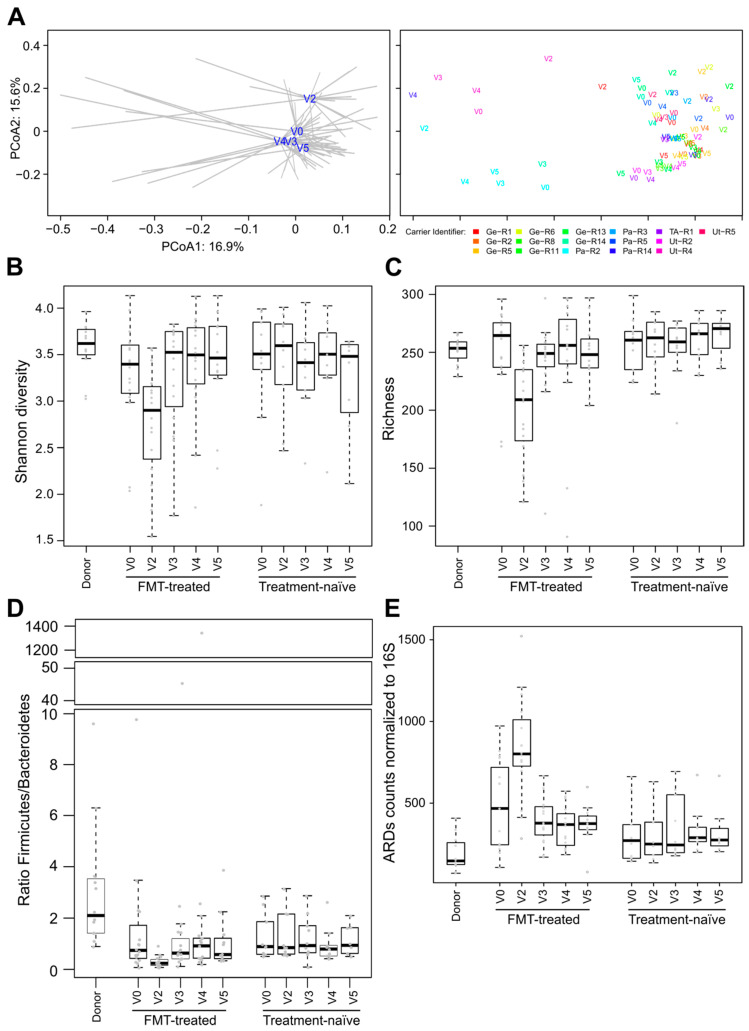
Figure 2.
Effect of colistin/neomycin on microbiota composition of FMT-treated carriers. (A) PCoA plots of microbiota profiles computed on the species relative abundance of FMT-treated individuals. On the left, centroids (averaged microbiota profiles) from each time point of FMT-treated carriers are represented. Each sample is connected to its corresponding centroid with grey lines. On the right, samples are labeled according to the time point and colored according to the carrier. Shannon diversity (B) and species richness (C) were computed after rarefying sequencing reads to 40,000. (D) Ratio of Firmicutes to Bacteroidetes. (E) Number of reads assigned to ARDs and normalized to 1000 16S rRNA gene read counts.

