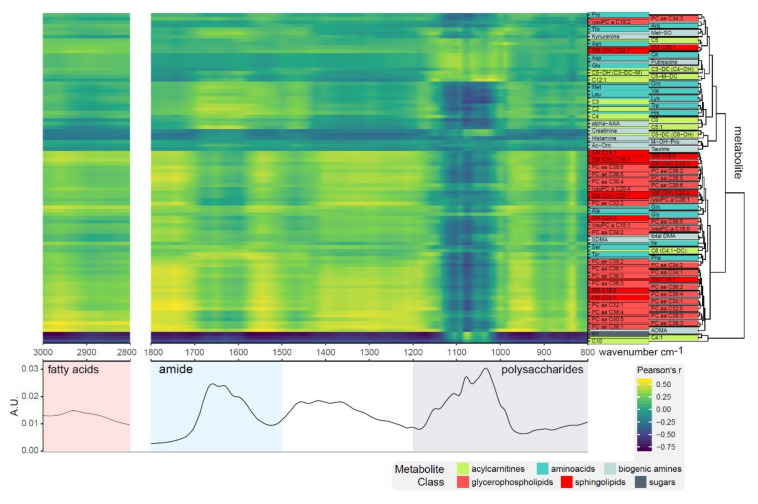
Figure 2.
Correlation profiles of metabolite concentrations with fatty acid, amide, and polysaccharide regions of the FTIR spectra for 4 h control samples. Clustering of metabolites revealed three distinct groups of small molecules; a cluster containing glucose correlating well with the polysaccharide band (1200–1000 cm−1); a second cluster primarily made up of lipids correlating well with the lipid region (3000–2800 cm−1); and a third cluster of amino acids, biogenic amines, and acylcarnitines.

