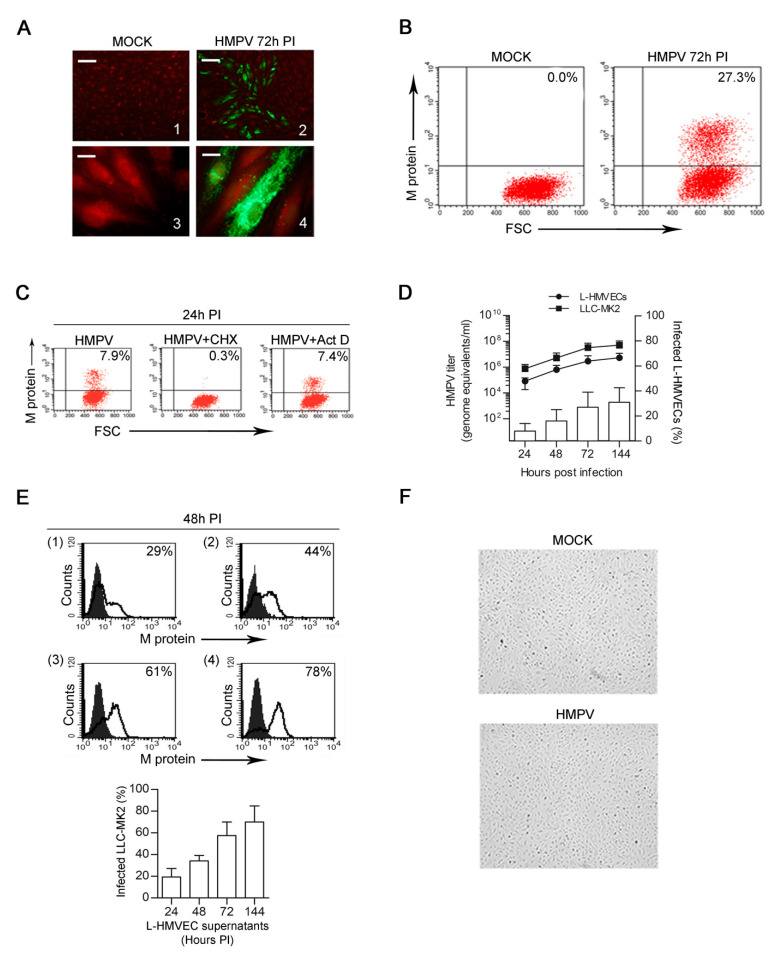
Figure 1.
HMPV infection of L-HMVECs. (A) Fluorescent microscopy analysis of mock- (left panels) and HMPV-infected (right panels) showing the expression of viral antigens in infected cells. Staining of fixed cells was performed with a mAb to the matrix (M) protein followed by a secondary step with an Alexa Fluor 488 anti-mouse and finally counterstained with Evan’s Blue. Photographs illustrate mock-(1) and HMPV-infected (2) L-HMVECs where a focus of infection is shown (Scale Bar = 50 μm). Enlarged images of mock-(3) or HMPV-infected (4) cells allow to visualize the typical HMPV punctate cytoplasmic staining (Scale Bar = 5 μm). Images are representative of 5 independent experiments. Images were taken 72 h PI (B) HMPV-infected L-HMVECs were quantified by flow cytometry. Cells were mock-infected (left panel) or infected (right panel) with infectious HMPV and the presence of the M protein was detected as in (A). Fluorescence was measured using a FACScan and data obtained were analysed using the CELLQuest software. Results are displayed as dot plots. Panel images were taken 72 h PI. Percentages of HMPV+ cells are shown in the upper right corner. (C) To confirm specificity of M protein staining, L-HMVECs were infected with HMPV in the presence or absence of 30 μM cycloheximide or 1 μM actinomycin D. Cells were analysed at 24 h PI (D) HMPV replication kinetic in L-HMVECs. Left scale: L-HMVECs were infected and cell culture supernatant samples were collected at the indicated time points. Quantitation over time of HMPV RNA present in purified nucleic acid derived from infected L-HMVEC (●) was determined by rtPCR. RNA derived from the permissive cell line LLC-MK2 infected with HMPV served as control of replication (■). Data indicate mean viral loads (number of copies per mL of supernatant) ± SD of five independent experiments. Each quantitation was performed in three replicates. SD of the triplicate never exceeded 0.5%. Right scale: % of HMPV-infected L-HMVECs was quantified by flow cytometry, as described in A. Bars represent mean ± SD of five independent experiments (E) Release of infectious particles by L-HMVECs. LLC-MK2 were exposed for 3 h to the supernatants of HMPV-infected L-HMVECs harvested 24 (1), 48 (2), 72 (3), and 144 (4) h PI. After two days, the infected LLC-MK2 cells were quantified by flow cytometry. Fluorescence was measured using a FACScan and data obtained were analysed while using the CELLQuest software. In the upper panel histograms from one representative experiment out of three with similar results are shown. Solid graphs represent data obtained from LLC-MK2 exposed to supernatants derived from mock L-HMVECs. Percentages of HMPV+ cells are shown in the upper right corner of each panel. In the lower panel, bars represent the mean ± SD of the % of HMPV-infected cells detected in all the experiments performed (F) Light microscopy evaluation of uninfected (upper panel) and HMPV-infected monolayers (lower panel) at 6 days PI. ECs completely retain their characteristic morphology (Scale Bar = 50 μm).

