Figure 2.
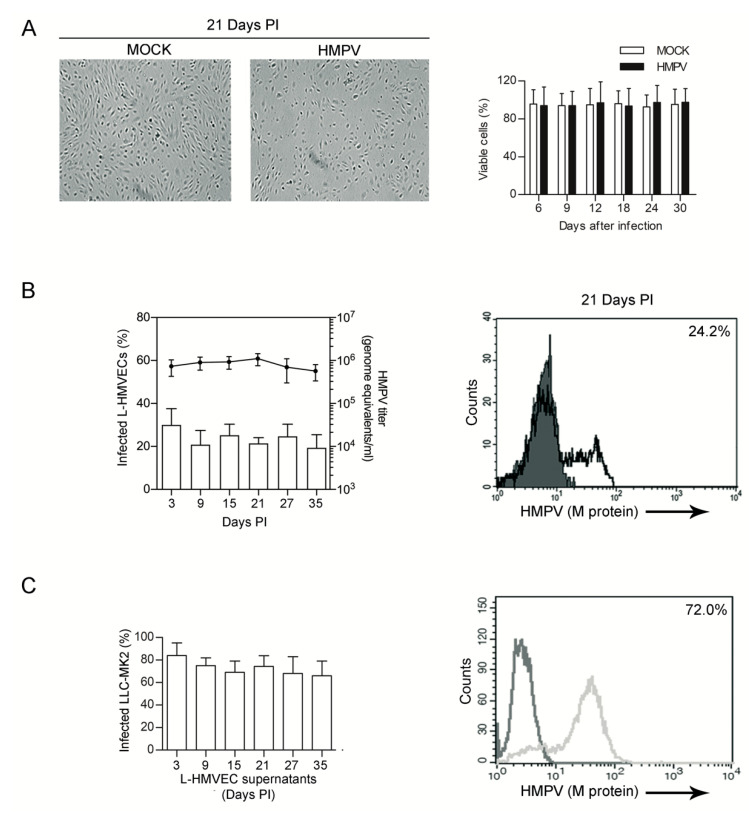
HMPV persistent infection of L-HMVECs (A) Left panel: Light microscopy evaluation of mock and HMPV-infected monolayers. At the third week of infection (day 21 PI), infected cells appear less abundant, but retain the EC characteristic morphology (Scale Bar = 50 μm). Right panel: Bars represent % of mock (□) and HMPV-infected (■) viable cells at the indicated time points, as assessed by trypan blue exclusion assay. (B) Release of virus by long term cultured L-HMVECs. Left panel: Bars (left axis scale) indicate the % of HMPV-infected L-HMVECs, as assessed by flow cytometry, at the indicated time of collection. Line (right axis scale) are mean viral loads (number of genome copies per mL of supernatant) at the indicated time of collection. The viral titer in culture supernatant was always determined 72 h after the culture medium was changed. Data are means ± SD from 3 independent experiments. Right panel: Representative flow cytometric analysis of infected L-HMVECs at 21 days PI. HMPV M antigen expression was evaluated as described in Figure 1. Percentage of HMPV+ cells is shown in the panel upper right corner. (C) Release of infectious particles by persistently infected L-HMVECs. LLC-MK2 were exposed for 3 h to the supernatants of HMPV-infected L-HMVECs collected at different time points. After six days, the rate of HMPV-infected LLC-MK2 cells was quantified by flow cytometry. Left panel: Bars represent the mean ± SD of the % of infected LLC-MK2 detected in 3 independent experiments. In the horizontal axis are indicated the day of harvesting of HMPV-infected supernatants from L-HMVECs. In the right panel a representative histogram of LLC-MK2 infected with supernatants from HMPV-infected L-HMVECs at 21 days PI is shown. Light histogram represents data obtained from LLC-MK2 exposed to supernatants derived from mock L-HMVECs.

