Figure 4.
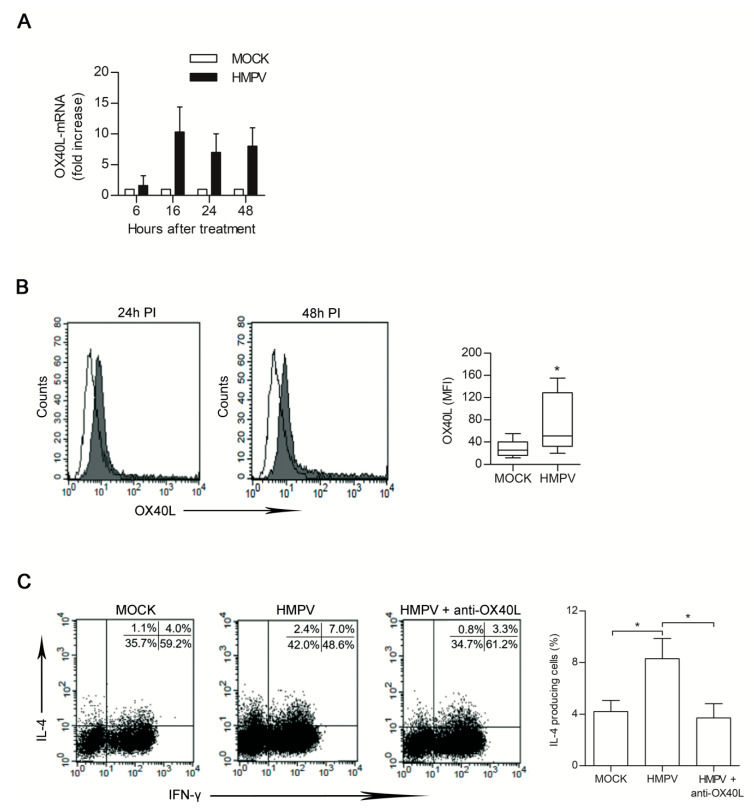
HMPV-infected secretome (21 days PI) induces OX40L expression in dendritic cells (DCs). (A) DCs treated with mock and HMPV-secretome were harvested at the indicated times. OX40L transcripts were analysed by rtPCR and mRNA levels were normalized using β-actin mRNAs detected in the same samples. Results are expressed as fold induction over the levels detected in mock cells at the same time points. Bars represent the mean ± SD of five independent experiments. (B) Left panel: Flow cytometric analysis of OX40L expression on DC surface. DCs were analysed for OX40L expression upon 24 h and 48 h of treatment with mock (open line) or HMPV-infected (solid line) secretomes. Histograms are from one representative experiment. Box-plots in the right panel show the mean florescence intensity (MFI) values of OX40L expression from 10 independent experiments. Lower quartile, median, upper quartile, and largest observations are represented. * p < 0.05. (C) Naïve CD4 T cells were cultured with DCs primed with HMPV-infected secretome in the presence or absence of anti-OX40L neutralizing mAb. After seven days, cells were analysed by flow cytometry for intracellular expression of IFN-γ and IL-4. Dot-plots in the left panel represent one out of the three independent experiments performed; numbers indicate the % of positive cells in each quadrant. Bars in the right panel represent the mean % ± SEM of IL-4-producing cells of three performed experiments upon the indicated treatment. * p < 0.05.

