Figure 6.
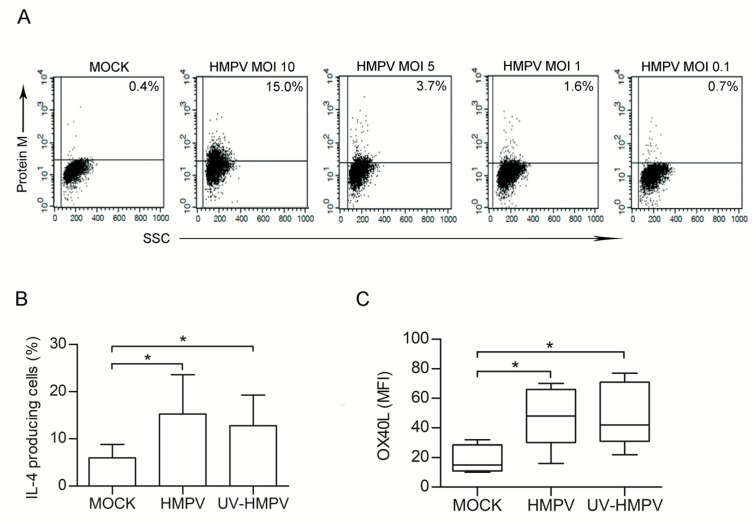
HMPV is capable, per se, to skew DCs toward a pro-Th2 phenotype. (A) DCs were left untreated or infected with HMPV at different MOIs (10, 5, 1, 0.1). After 48 h cells analysed by flow cytometry for the intracellular expression of the viral M protein. Dot plots show the fluorescence values vs the side scatter. Numbers in the upper right corner represent the % of cells expressing HMPV. Results are from one representative experiment out of 4 performed. (B) DCs were left untreated (MOCK) or treated for 48 h with UV-inactivated (UV-HMPV) or infectious (HMPV) HMPV at MOI 1. Allogenic coculture of DCs with naïve T cells was then performed and infectious IL-4 expression was evaluated as in Figure 3. Bars represent the mean ± SEM of IL-4-producing cells (%) detected upon the described culture conditions. Results are from one representative experiment out of four performed. * p < 0.05 (C) OX40L expression on DCs surface was evaluated upon 48 h of treatment with medium (MOCK) UV-inactivated (UV-HMPV) or infectious (HMPV) virus at MOI 1. Box-plots show the MFI values of OX40L expression detected in eight independent experiments. Lower quartile, median, upper quartile, and largest observations are represented. * p < 0.05.

