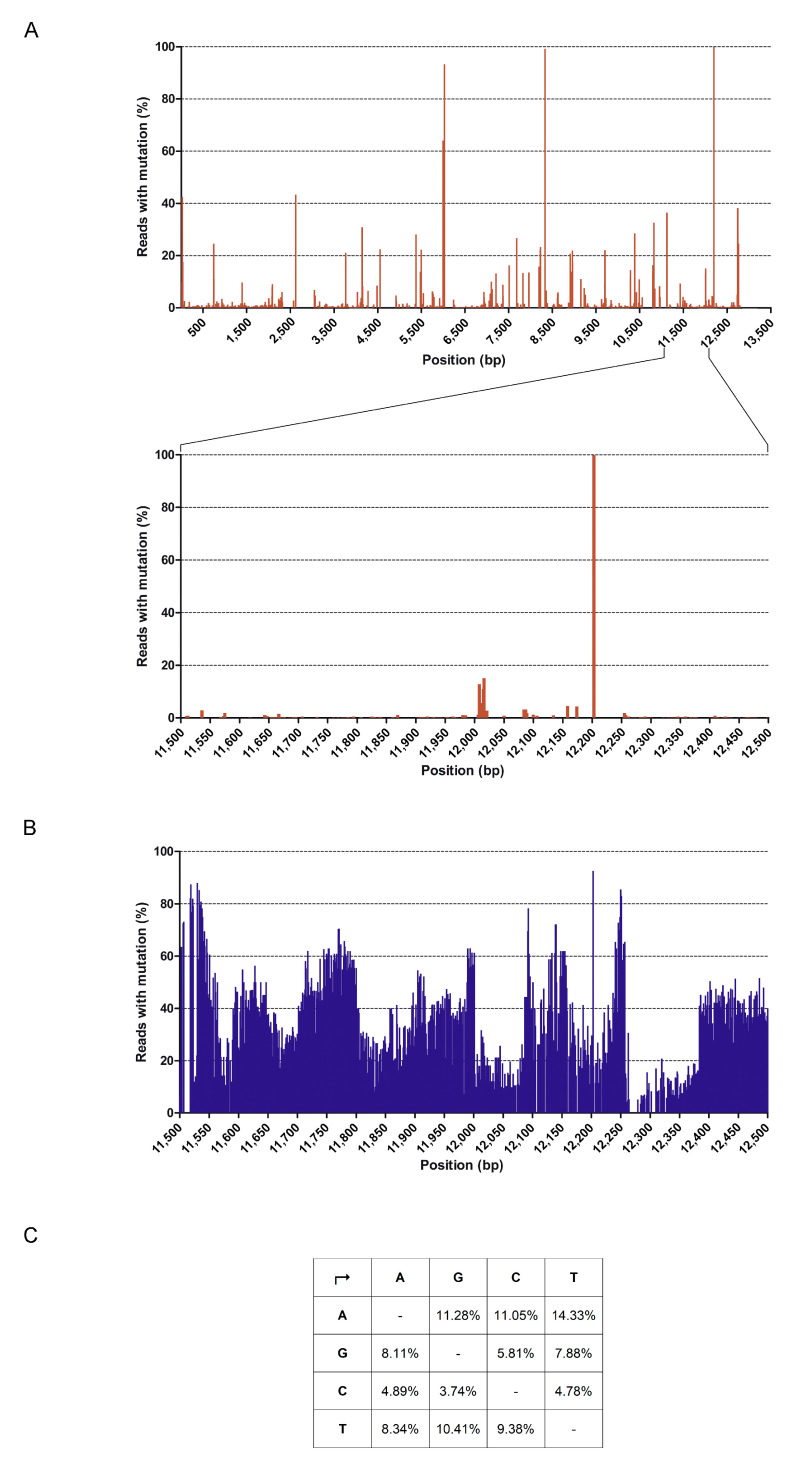
Figure 7.
Sequence variability detected in the HMPV stock. (A) The upper graph represents the % of reads displaying mutations in comparison to the reference sequence AF371337.2 at each nt position detected, as assessed by NGS. Nt positions in the HMPV genome are reported in the x axis. An enlargement of nt positions 11,500–12,500 is also shown (lower graph). (B) Graph shows sequence variability at nt positions 11,500–12,500. Alignment to AF371337.2 was performed using NGS reads obtained by lowering homology parameters. (C) Table represents the % of bases substitution occurring at each nt position in comparison to Ref AF371337.2. Analysis was performed for the genome region at nt 11,500–12,500.

