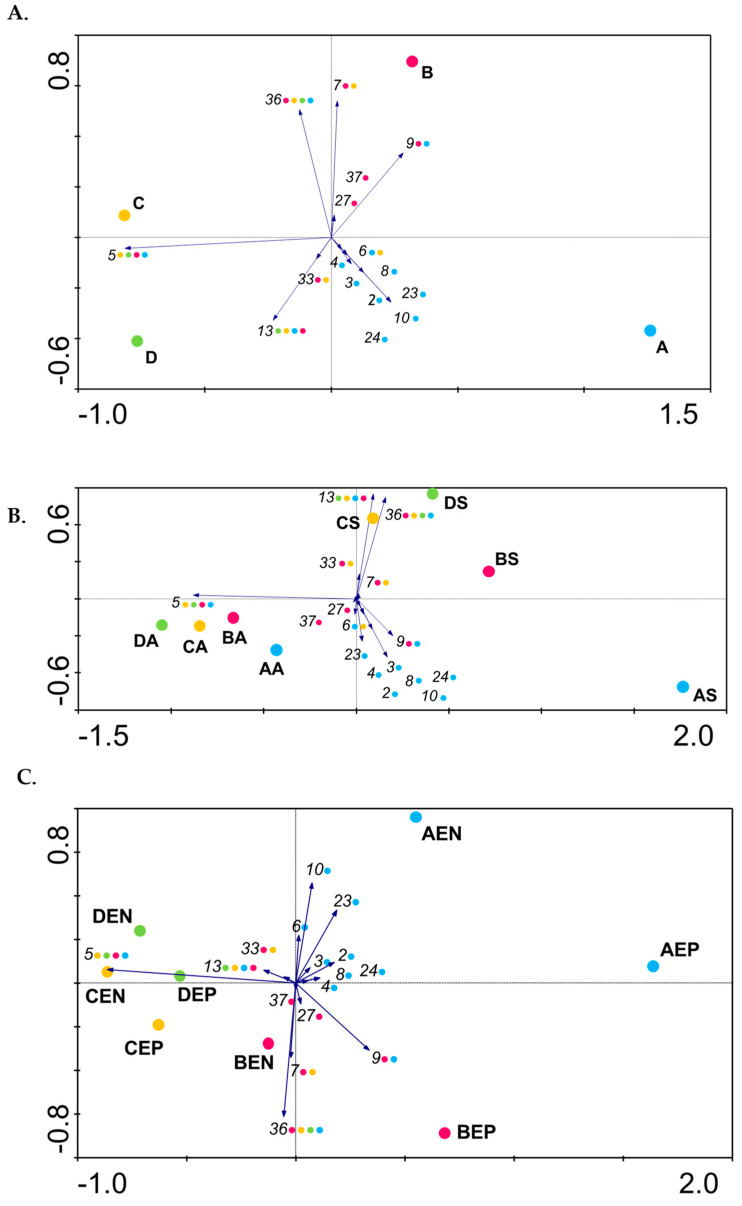
Figure 2.
Principal Coordinates Analysis (PCoA) plots generated from Psa profiles identified in the four studied orchards using CANOCO 5 [58]. PCoA plots were constructed to (A) ascertain the distribution of Psa populations within and between orchards; (B) the distribution of Psa profiles in spring and autumn; and (C) the distribution of Psa profiles as epiphytic or endophytic profiles in the different orchards. Numbers correspond to Psa profiles and arrows identify the weight that each profile had on the diversity relationship between orchards. Blue, profiles isolated from orchard A (A); pink, from orchard B (B); yellow, from orchard C (C); green, from orchard D (D). A, autumn; S, spring; EN, endophytic; EP, epiphytic.

