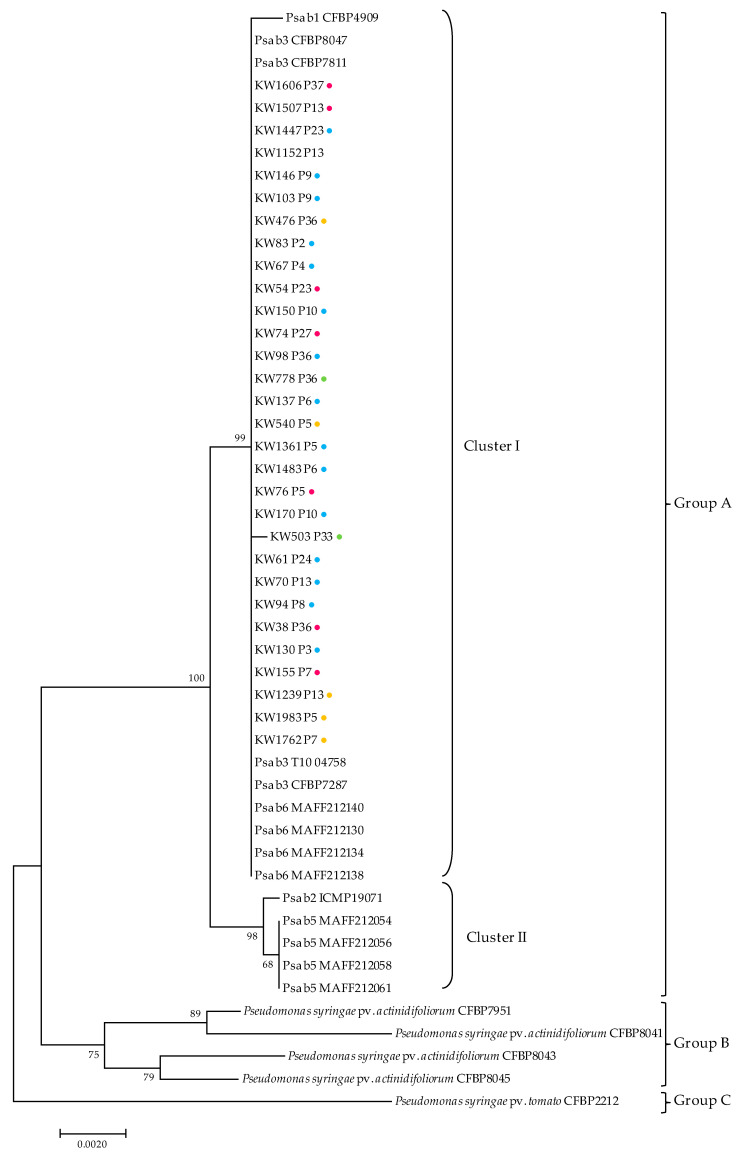
Figure 3.
Maximum likelihood tree inferred from the concatenated partial sequences of four housekeeping genes (gapA, gltA, gyrB, and rpoD) from selected Psa strains (Table S2). P. syringae pv. tomato was used as outgroup. Labels P1 to P36 indicate the Psa BOX profile; b, biovar; bootstrap support values (1000 replicates) are indicated at each node. Scale bar, 0.02 inferred nucleotide substitutions per nucleotide position. Blue dot, profiles isolated from orchard A; pink, from orchard B; yellow, from orchard C; green, from orchard D.

