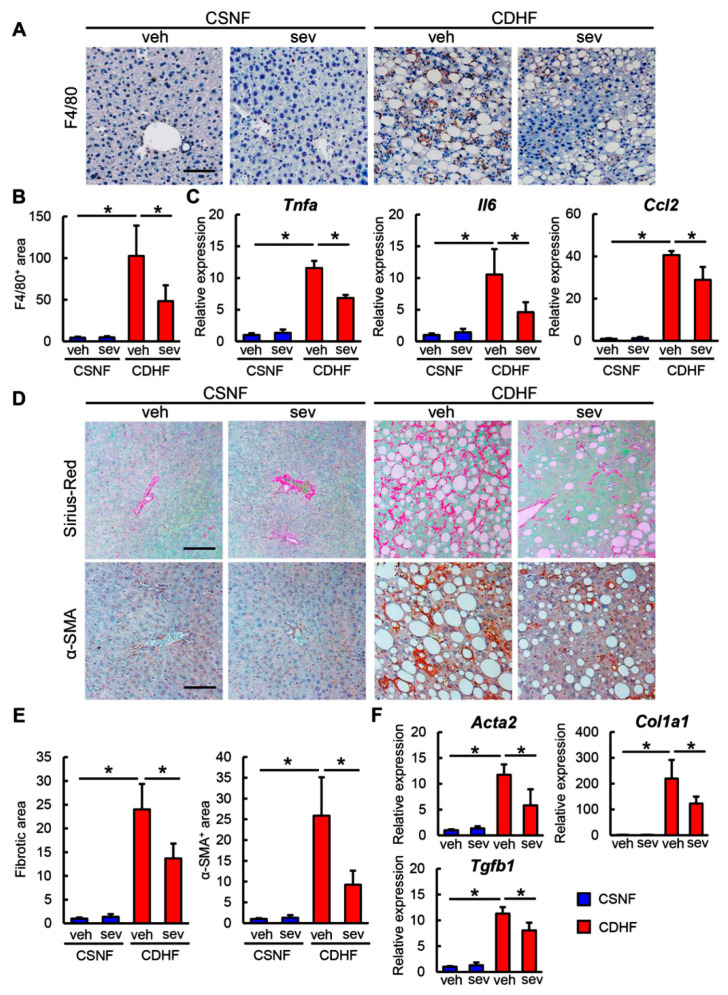
Figure 3.
Effects of sevelamer on hepatic inflammation and fibrosis in CDHF-fed mice. (A) Representative microphotographs of liver sections stained with F4/80. Scale bar: 50 µm. (B) Semi-quantitation of F4/80 immuno-positive macrophages in high-power field (HPF) by NIH imageJ software. (C) Relative mRNA expression levels of proinflammatory cytokines, Tnfa, Il6 and Ccl2 in the liver of experimental groups. (D) Representative microphotographs of liver sections stained with Sirius Red (upper panels) and α-SMA (lower panels). Scale bar: 50 µm. (E) Semi-quantitation of Sirius Red-stained fibrotic area (left panel) and α-SMA immune-positive area (right panel) in HPF by NIH imageJ software. (F) Relative mRNA expression levels of fibrosis markers, Col1a1, Acta2 and Tgfb1 in the liver of experimental groups. (C,F) The mRNA expression levels were measured by quantitative RT-PCR (qRT-PCR), and 18s rRNA was used as internal control for qRT-PCR, and quantitative values are indicated as ratios to the values of CSNF + veh group. Vehicle (veh), sevelamer (sev), choline-sufficient amino acid containing normal fat (CSNF), choline-deficient, L-amino acid-defined containing high-fat (CDHF). Data are mean ± SD (n = 10). * p < 0.05, indicating a significant difference between groups.

