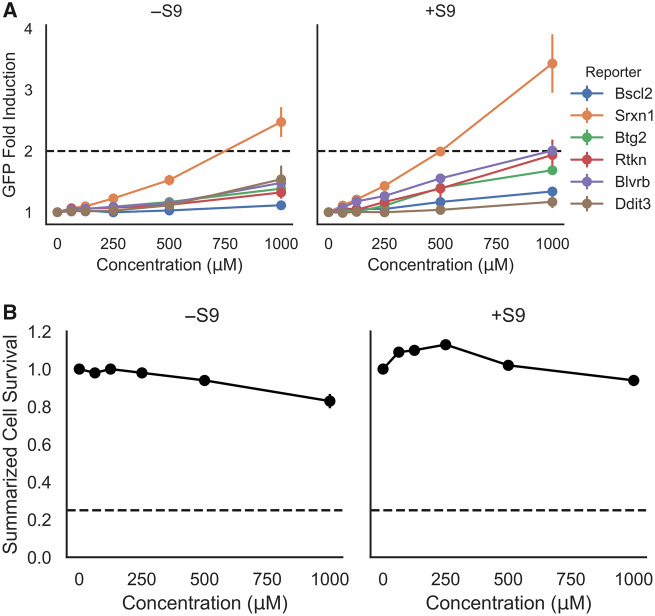
Figure 4.
A, The ToxTracker toxicity pathway markers Bscl2-GFP and Rtkn-GFP (DNA damage), Btg2-GFP (p53-associated cellular stress), Srxn1-GFP and Blvrb-GFP (oxidative stress), and Ddit-GFP (unfolded protein response) observed by flow cytometry after 24 h exposure to coumarin (0, 62.5, 125, 250, 500, and 1000 μM) in mES cells. A 2-fold green fluorescent protein (GFP) induction level was defined as the threshold for a positive test result, whilst the cell survival rate determined by cell count was always > 25%. Each data point on the graph represents the mean fold induction of 3 independent experiments ± SD. B, Summarized cell survival is expressed as the average across all cell lines and the 3 independent experiments ± SD per concentration. .

