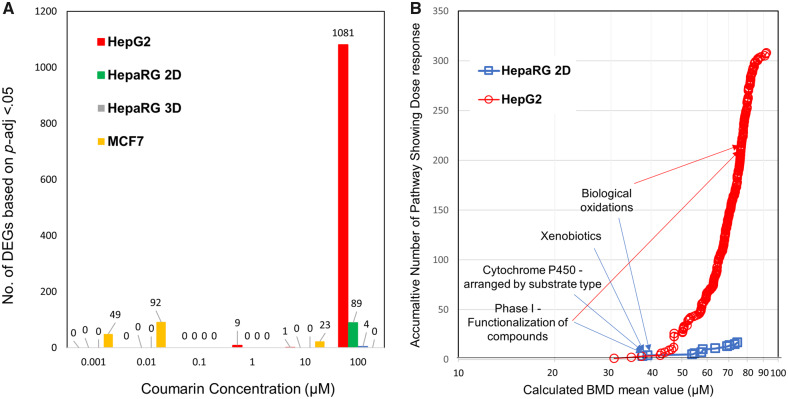
Figure 6.
Summary of transcriptomic data analysis. A, Total Differentially Expressed Genes (DEGs) identified for each concentration for each cell line following DESeq2 analysis highlighting limited responses until the highest dose. B, Pathway based Benchmark Dose (BMD) mean accumulation plot. Each data point represents the total number of Reactome pathways that met the significance criteria for both HepG2 (o) and HepaRG (□) cell lines plotted against the corresponding calculated BMD mean value across the range of signaling pathways identified. The curves slope indicates the rate that pathways are showing differential regulation as concentration increases. Labeled are the lowest reported Reactome pathways for each HepaRG and where they correspondingly are identified in the HepG2 accumulation curve.

