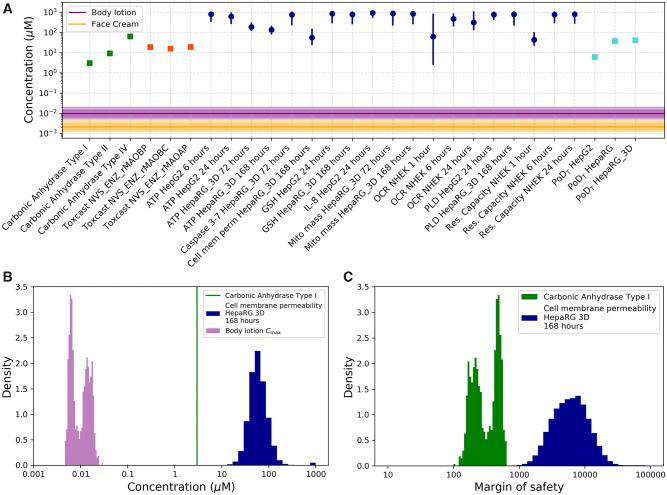
Figure 8.
A, Margin of safety (MoS) plot for face cream (orange band) and body lotion (purple band). Plasma Cmax (total, μM) expressed as distribution, purple or orange line (median, 50th percentile), inner dark band (25–75th percentile), outer light band (2.5th–97.5th percentile [95th credible interval]). Points of departure (PoDs) expressed as nominal concentration (μM) as single values for carbonic anhydrase enzymatic assays (green squares), monoamine oxidases (MAO) enzymatic assays (red squares), and transcriptional point of departure (PoDT) from high-throughput transcriptomics assays (light blue squares). PoDs from cell stress panel (dark blue circles) are reported in terms of the mode (circle) and the 95% credibility interval (solid lines). B, Histogram representations of the distribution for the predicted Cmax (purple), example PoD distribution from the stress panel (blue) and PoD summarized as point-estimate from PubChem (green). C, Distributions for the MoS calculated using both examples. Abbreviations: NHEK, normal human epidermal keratinocytes; OCR, oxygen consumption rate.

