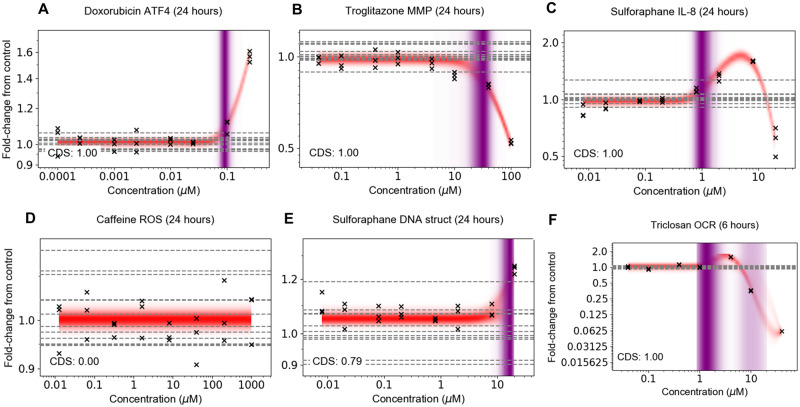
Figure 2.
Representative concentration response data and model fits. (A) Concentration response that strictly increased, (B) strictly decreased, and (C) increased but then decreased at a higher concentration. (D) Example where the substance had negligible influence on the measured biomarker at all tested concentrations. (E) Example in which there was a high uncertainty regarding whether the observed change was due to the test chemical, a chance fluctuation in the replicates and/or a bias in the response due to well location or due to well position. F) Example in which the PoD distribution is bimodal, resulting in more than one plausible PoD found by the model to be consistent with the data. Crosses correspond to individual data points; horizontal dashed lines indicate control values.

