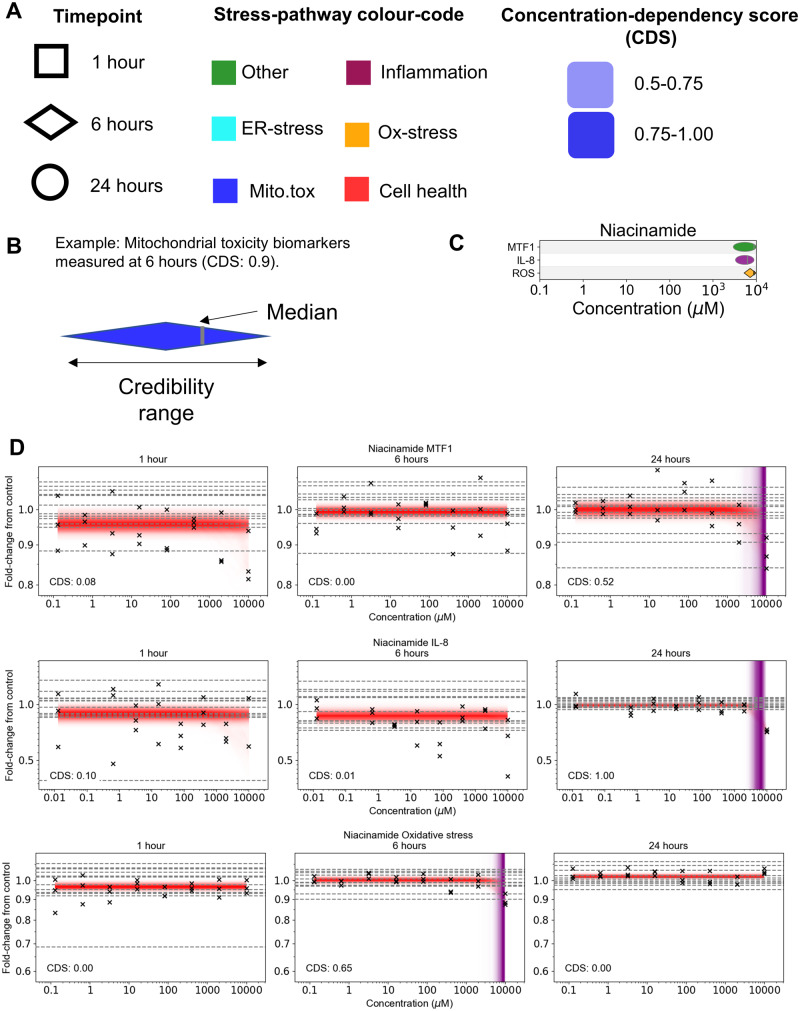
Figure 3.
Overview of PoD summary plots. A, Information on the PoD timepoint, stress pathway, and CDS are indicated using shape, color and depth of shading. B, The credibility range for the representative PoD is indicated using the width of the symbol, the median is given by a vertical gray line. C, PoD summary plot for niacinamide. D, Corresponding niacinamide concentration-response data. Crosses correspond to individual data points; horizontal dashed lines indicate control values.

