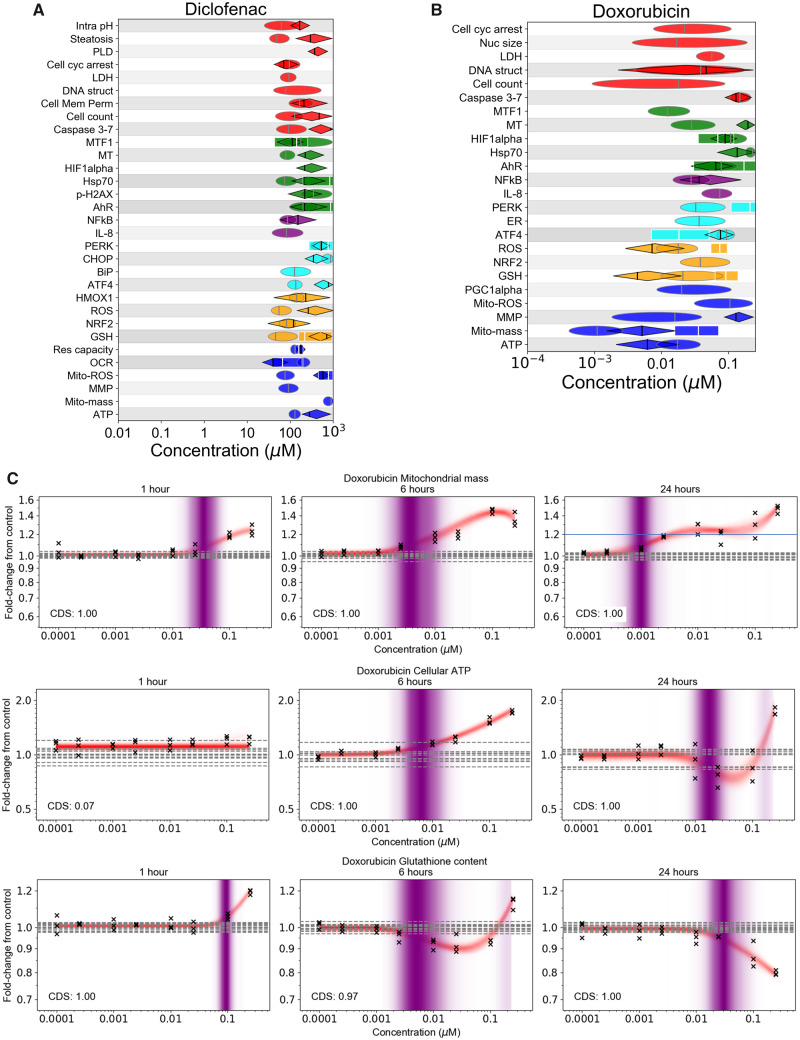
Figure 4.
Summary of group 2 substances, diclofenac and doxorubicin. (A) PoD summary plot for diclofenac and (B) doxorubicin (see Figure 3A for corresponding legend). C, Concentration responses to doxorubicin for mitochondrial mass, cellular ATP, and glutathione content at 1, 6, and 24 h. The PoD distributions (indicated by purple shading) for cellular ATP at 24 h and glutathione at 6 h were both bimodal (ie, two district shaded bands); the lower mode was selected as the representative mode in both cases. Crosses correspond to individual data points; horizontal dashed lines indicate control values.

