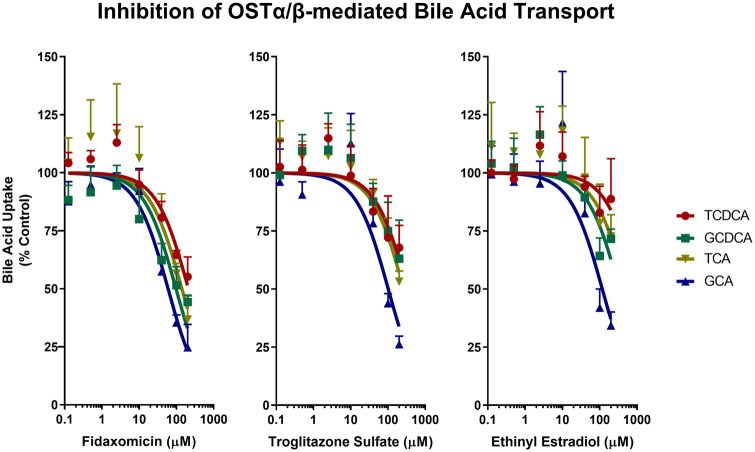
Figure 3.
Inhibition of OSTα/β-mediated uptake of taurochenodeoxycholate (TCDCA; 5 µM), glycochenodeoxycholate (GCDCA; 5 µM), taurocholate (TCA; 5 µM), and glycocholate (GCA; 5 µM) by fidaxomicin, troglitazone sulfate, and ethinyl estradiol over a concentration range of 0.125–200 µM. Solid symbols represent bile acid uptake after subtracting uptake in Mock cells from uptake in OSTab cells, followed by vehicle control normalization. Data represent mean ± SD (n = 3, in triplicate), as described in the Materials and Methods section. Only the SD in the upper direction is shown. The apparent half-maximal inhibitory concentration and corresponding 95% confidence interval for each bile acid substrate were determined by nonlinear regression using GraphPad Prism version 8.2.0 (Table 2). Abbreviations: Mock cells, mock-transfected cells; OSTab cells, OSTα/β-overexpressing cells.

