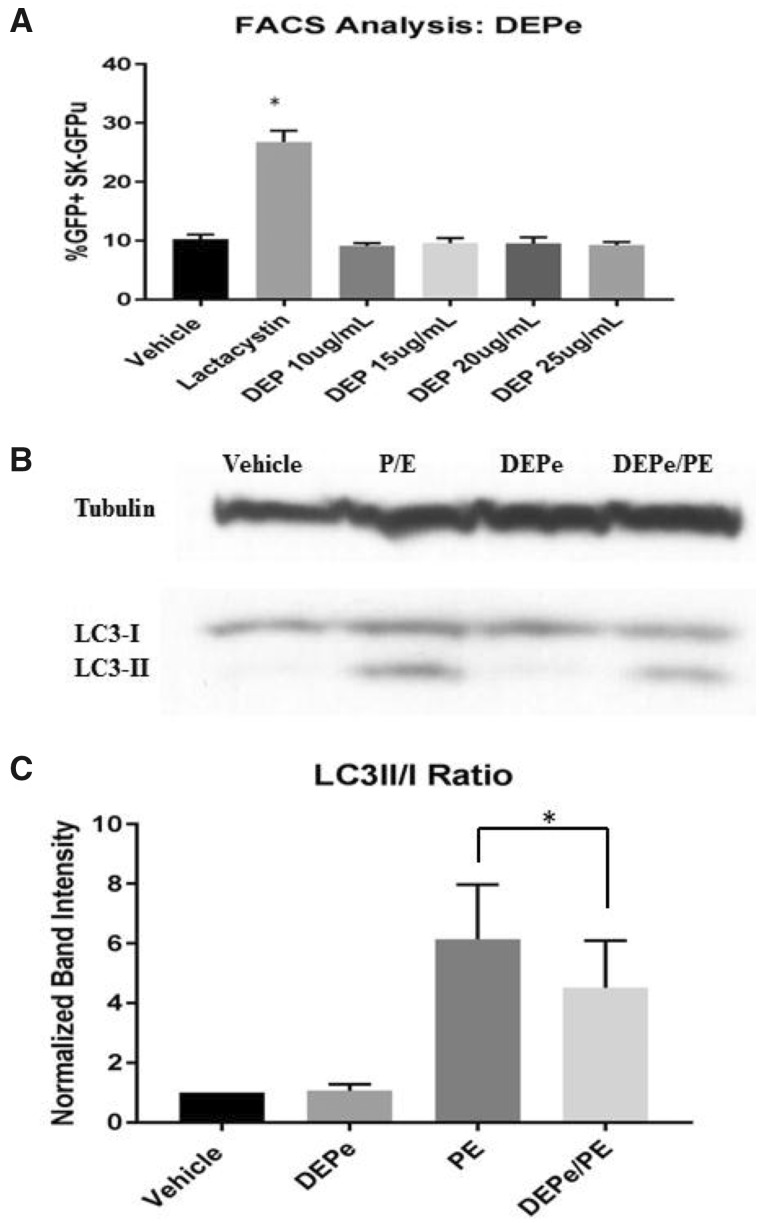
Figure 4.
Proteasome function and autophagy in cells after DEPe treatment. Using SK-N-MC expressing a GFPu degron, cells were analyzed by FACS for GFP intensity after treatment with DEPe. Quantification of the % of GFP-positive cells represents the degree of proteasome inhibition. Lactacystin resulted in a statistically significant increase in GFP+ cells relative to control (2.5-fold increase), but DEPe did not alter GFP fluorescence (A). Data analysis by one-way ANOVA with Dunnett’s multiple comparisons analysis (*p = .0001). SK-N-MC cells treated with DEPe, P/E, or both were collected for protein purification after 24 h of treatment and run on a Western blot (B). Lysosomal inhibition with P/E caused a significant increase in LC3II/I ratio, but when combined with DEPe, showed a decrease in LC3II/I, indicating lower autophagic flux (C). Quantification of N = 5, Western blots; *p = .044 by paired Student’s t test.

