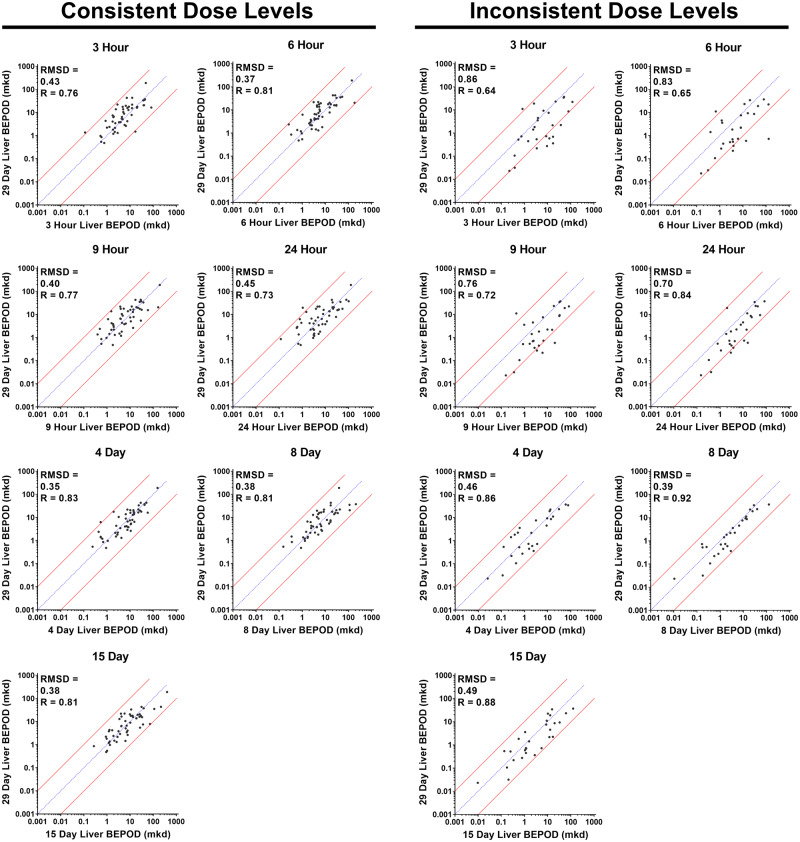
Figure 2.
Variation in the liver biological effect point of departure (BEPOD) across exposure time. Shown is a comparison of the liver BEPOD at 29 days with the liver BEPOD from 3 h to 15 days. Each graph contains a comparison of the liver BEPOD at 29 days to the liver BEPOD at an earlier exposure time point. In all graphs, each dot represents a distinct molecule, the blue line represents a 1:1 concordance, and the red lines represent the 10X boundary between values. Panels on the left contain data for molecules having the same (ie, consistent) dose levels selected for all time points. Panels on the right contain data for molecules having different (ie, inconsistent) dose levels used between single dose and repeated dose studies. Abbreviations: mkd, mg/kg (body weight)/day; R, Pearson R value; RMSD, root mean square difference value.

