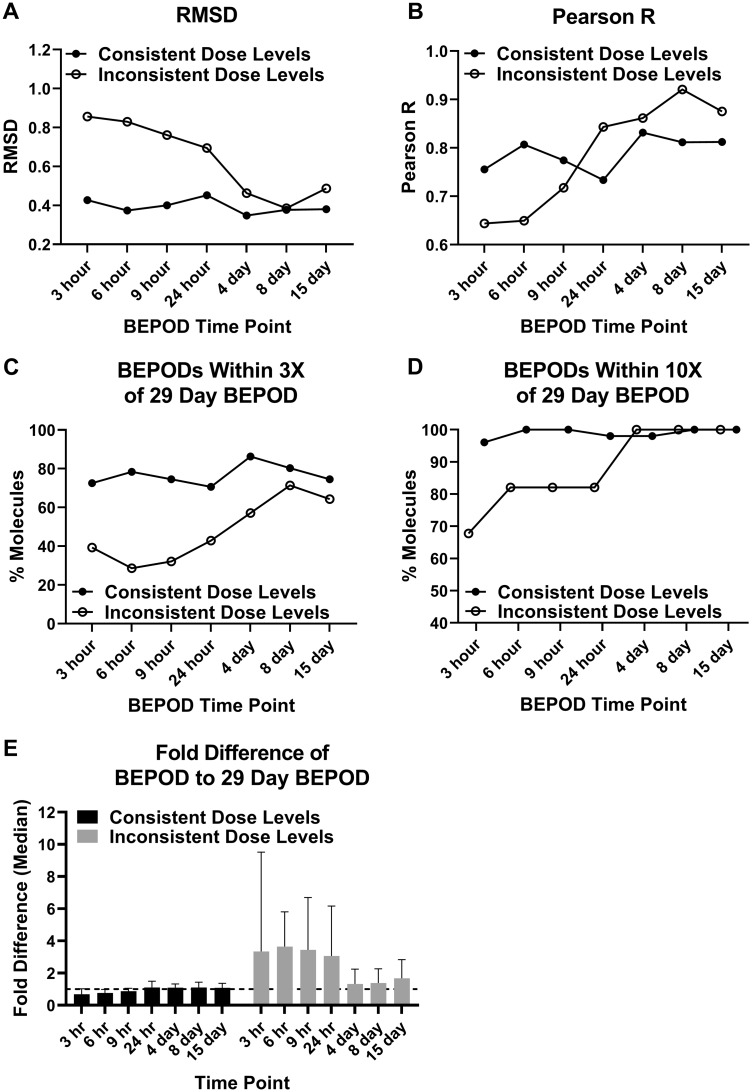
Figure 3.
Metrics quantifying the liver biological effect point of departure (BEPOD) variation across exposure duration. The dataset was divided into 2 groups: molecules with consistent dose levels used and molecules with inconsistent dose levels used. Each panel shows a different metric comparing the 29-day liver BEPOD with the liver BEPOD from 3 h to 15 days: (A) RMSD, root mean square difference; (B) Pearson R; (C) the percentage of molecules with a BEPOD within 3X of the 29-day BEPOD; (D) the percentage of molecules with a BEPOD within 10X of the 29-day BEPOD; and (E) the median fold difference between the BEPOD and the 29-day BEPOD. Data shown in panel E are the median with 95% confidence interval. To generate data shown in panel E, the molecule BEPOD at each exposure time point was divided by that molecule’s 29-day BEPOD. The dashed line in panel E is a value of 1.

