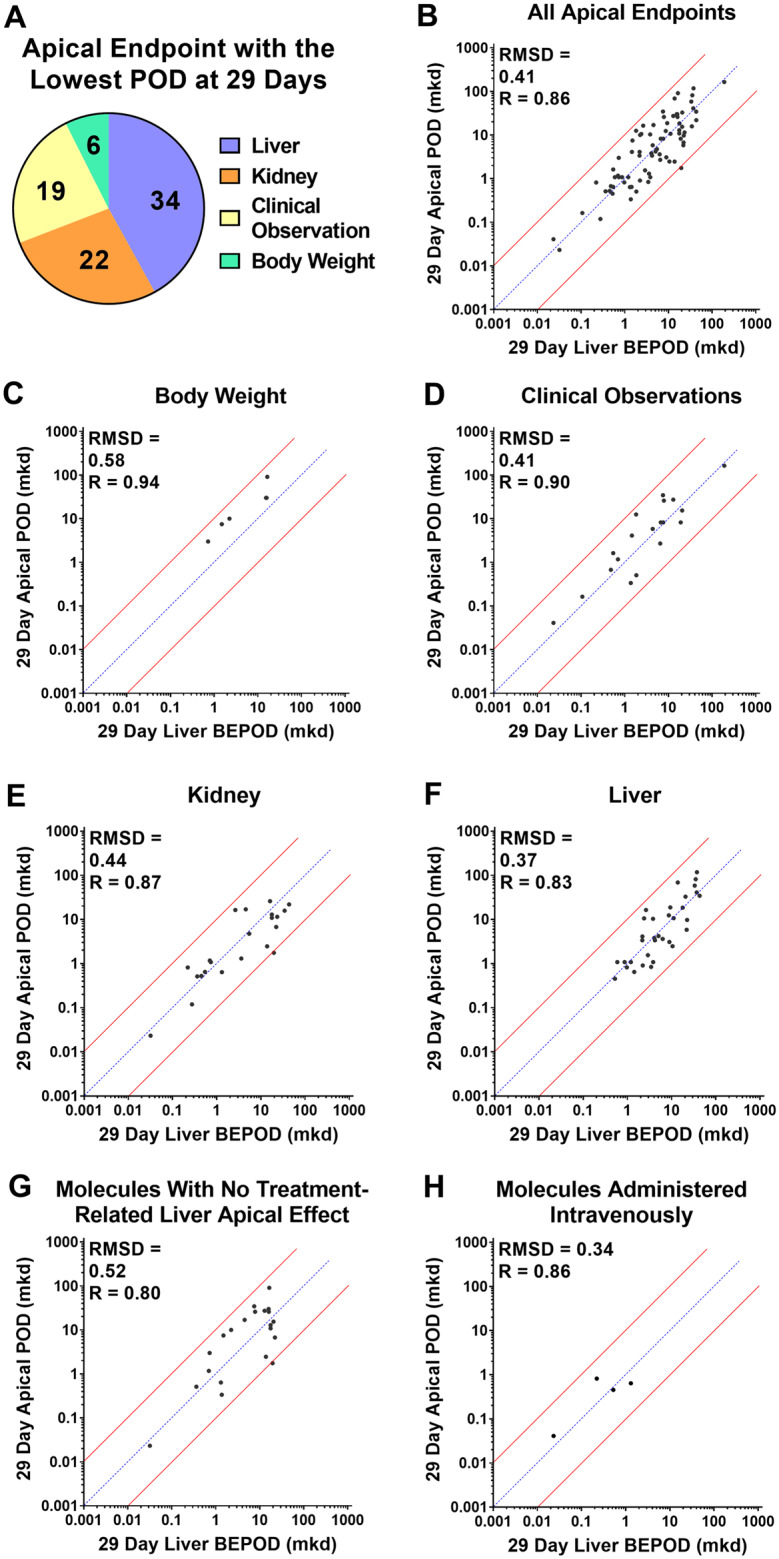
Figure 4.

Concordance of the liver biological effect point of departure (BEPOD) at 29 days with the apical point of departure (POD) in different compartments at 29 days. A, Shown here is the apical compartment with the lowest POD value after 29 days of exposure across all molecules examined. For two molecules, two compartments had the same POD values. B, Comparison of the 29-day liver BEPOD with the lowest 29-day apical POD value across all compartment (n = 79 molecules). C, Comparison of the 29-day liver BEPOD with the 29-day body weight POD for molecules having a body weight effect represent the lowest apical POD (n = 6 molecules). D, Comparison of the 29-day liver BEPOD with the 29-day clinical observation POD for molecules having a clinical observation effect represent the lowest apical POD (n = 19 molecules). E, Comparison of the 29-day liver BEPOD with the 29-day kidney POD for molecules having a kidney effect represent the lowest apical POD (n = 22 molecules). F, Comparison of the 29-day liver BEPOD with the 29-day liver POD for molecules having a liver effect represent the lowest apical POD (n = 34 molecules). G, Comparison of the 29-day liver BEPOD with the lowest systemic 29-day apical POD for molecules having no treatment-related liver apical effect (n = 21 molecules). H, Comparison of the 29-day liver BEPOD with the lowest systemic 29-day apical POD for molecules administered intravenously (n = 4 molecules). In panels B–H, each dot represents a unique molecule, the blue line represents a 1:1 concordance, and the red lines represent the 10X boundary between values. Abbreviations: mkd, mg/kg (body weight)/day; R, Pearson R value; RMSD, root mean square difference value.
