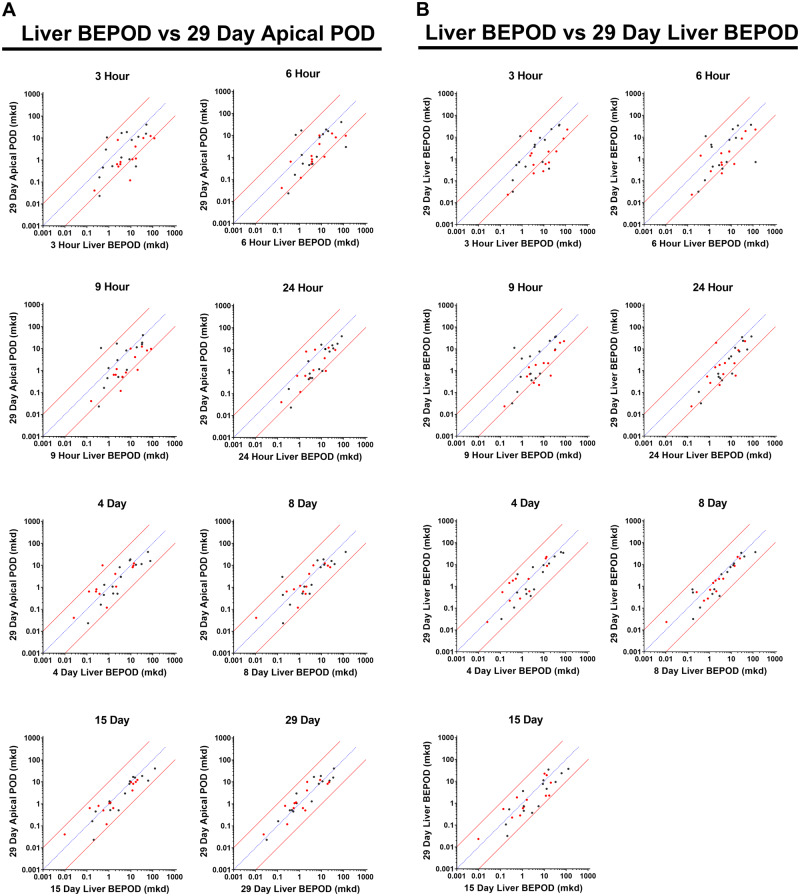
Figure 7.
Effect of dose level selection on point of departure (POD) concordance. A, These graphs show comparisons between the 29-day systemic apical POD and liver biological effect point of departures (BEPODs) from 3 h to 29 days. B, These graphs show comparisons between the 29-day liver BEPOD and liver BEPODs from 3 h to 15 days. In all graphs, each dot represents a distinct molecule, the blue line represents a 1:1 concordance, and the red lines represent the 10X boundary between values. Molecules having a single dose exposure low dose level 3–4X higher than the repeated dose low dose level are shown in black dots. Molecules having a single dose exposure (ie, 3–24 h) low dose level 10X higher than the repeated exposure (ie, 4–29 days) low dose level are shown in red dots. Abbreviation: mkd, mg/kg (body weight)/day.

