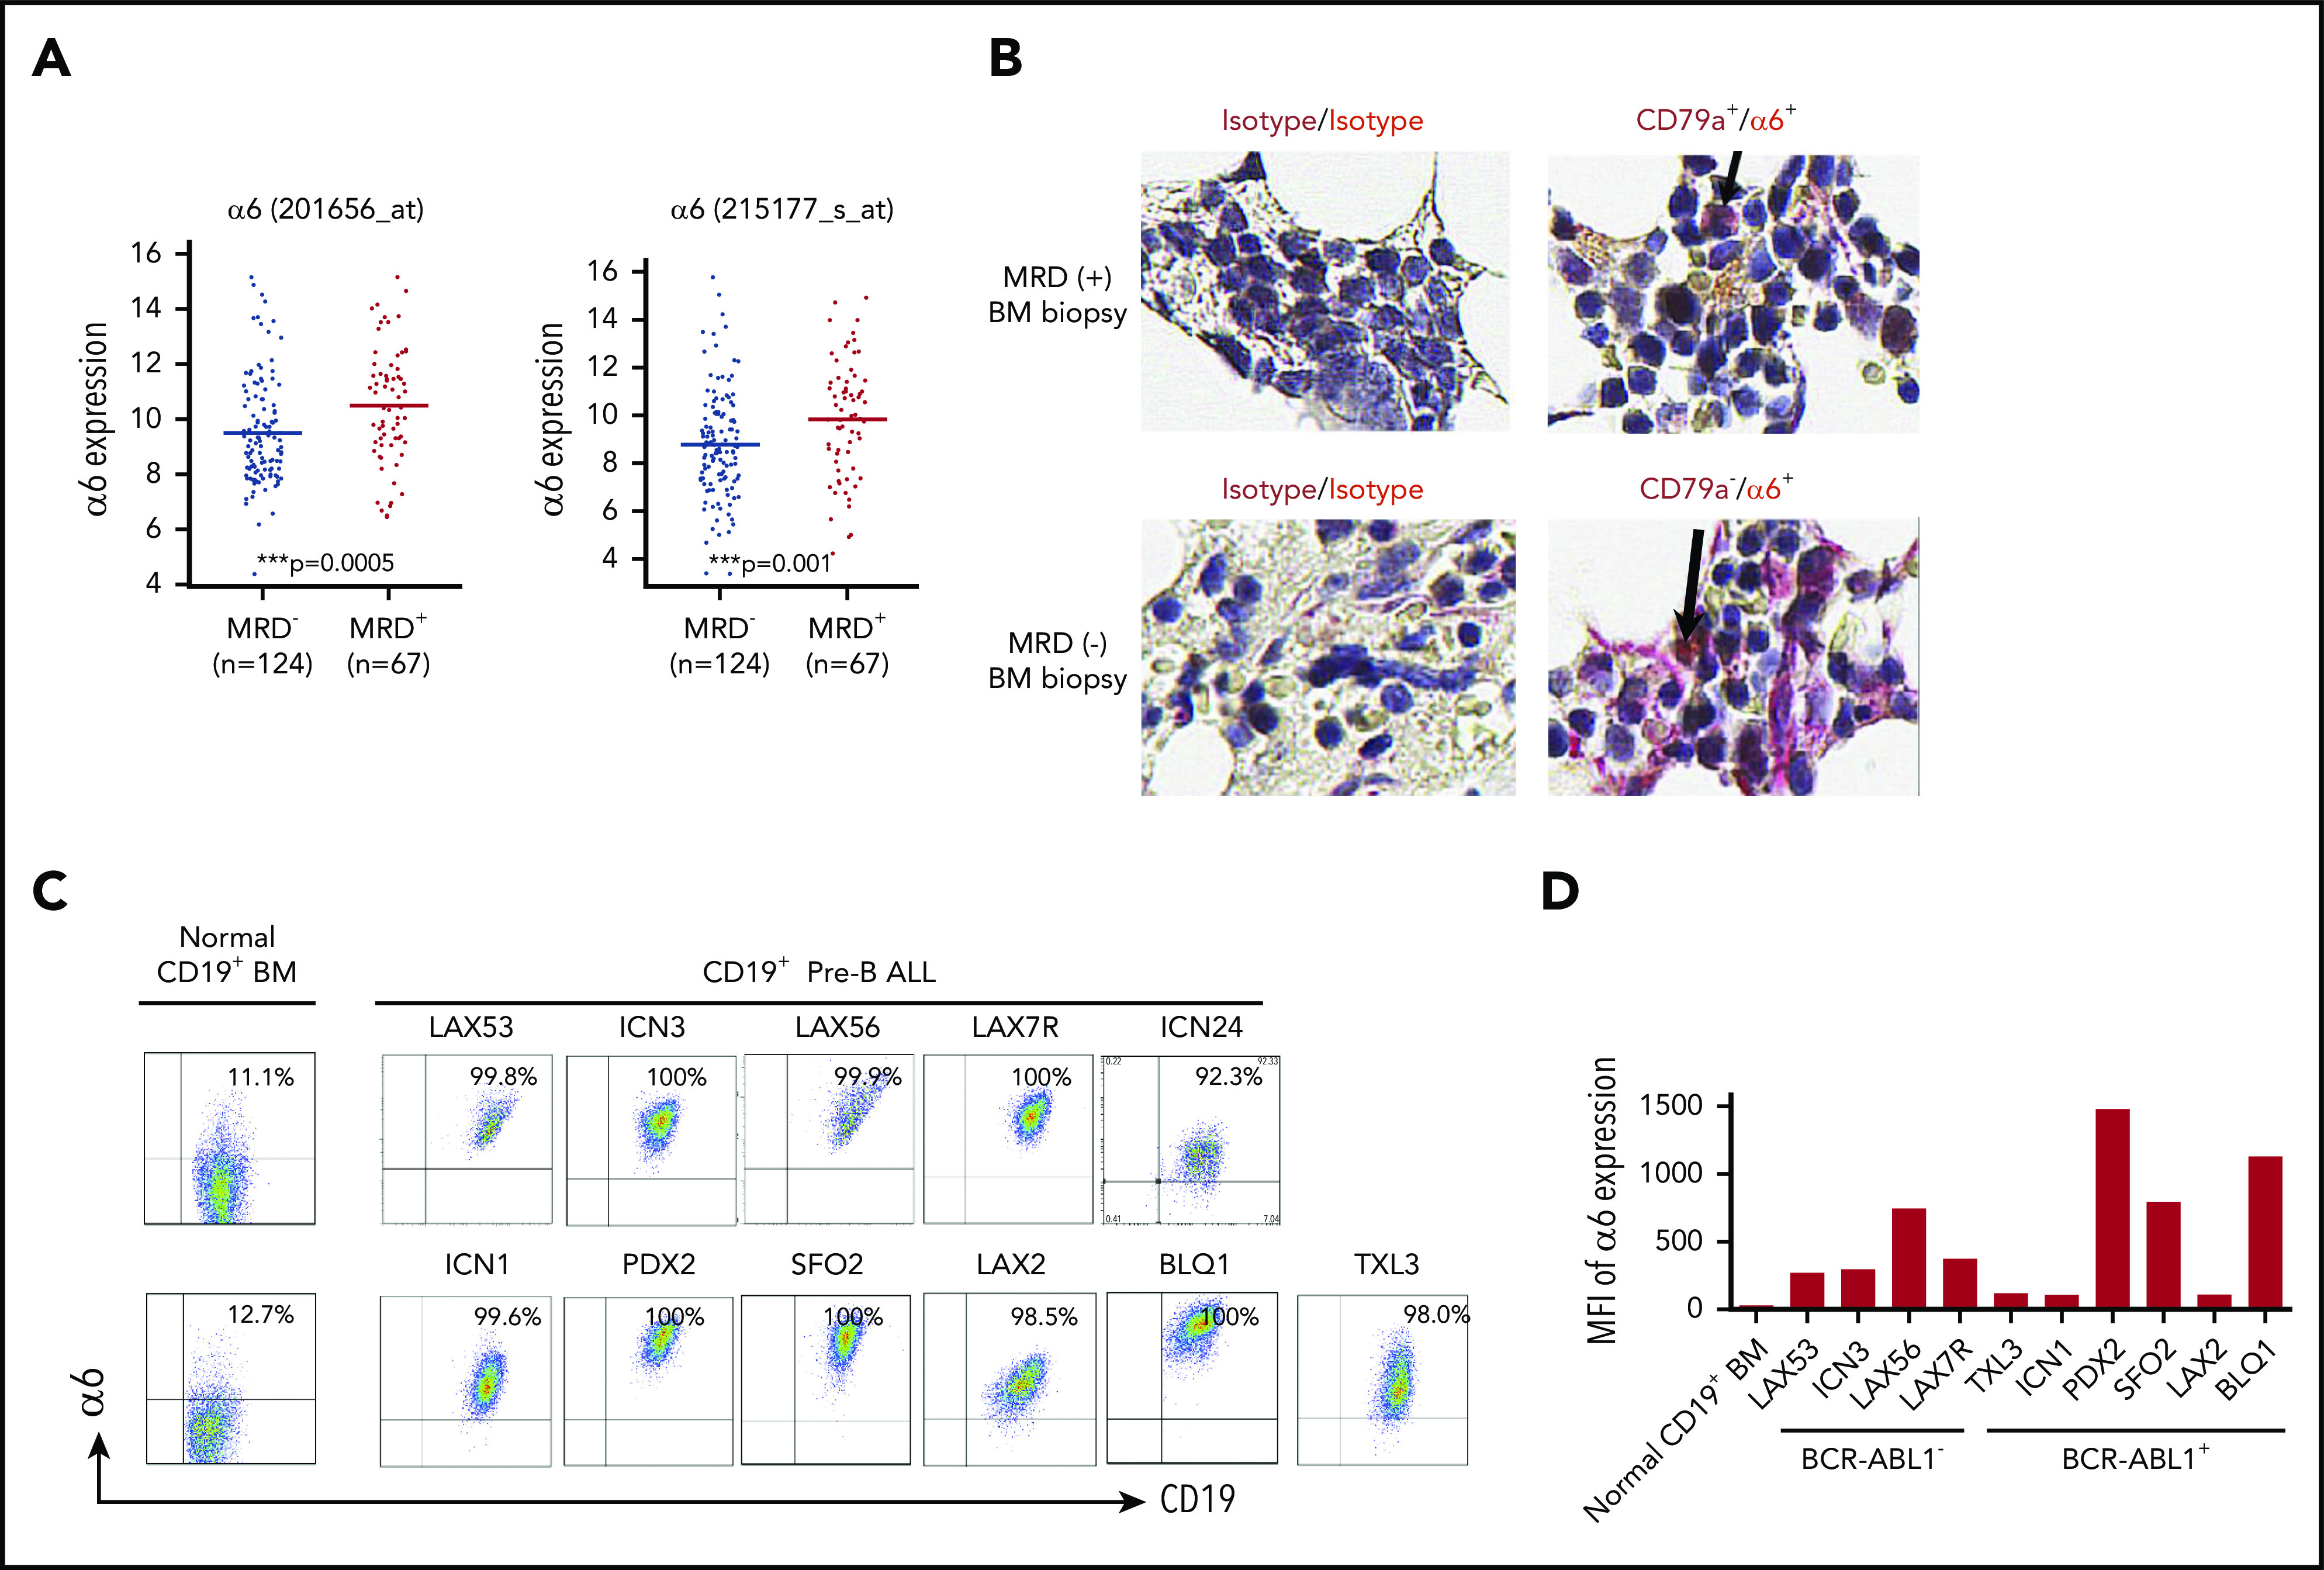
Figure 1.

Integrin α6 is highly expressed in primary B-ALL. (A) Two probe sets for integrin α6 (ITGA6) in patients with MRD+ and MRD– ALL from COG study P9906 were analyzed. MRD was measured by flow cytometry at the end of induction therapy (day 29) using patients’ BM or PB samples. RNA was purified from 191 pretreatment diagnostic samples with more than 80% blasts (131 BM; 76 PB). The horizontal bars indicate the average levels of integrin α6 expression. P values were obtained by using the Wilcoxon test for each probe set. ***P = .0005 for probe 201656_at; ***P = .001 for probe 215177_s_at. (B) Immunohistochemical staining of isotype controls (left panel) or CD79a (brown) and α6 (red) expression (right panel) in MRD+ and MRD– biopsy specimens. Original magnification, ×630. (C) Representative dot plots of cell-surface α6 expression in B-ALL and normal BM CD19+ B-cell samples. One of 3 experiments is shown. (D) Representative mean fluorescence intensity (MFI) of α6 expression in CD19+ B-ALL and normal BM CD19+ B cells. One of 3 experiments is shown.
