Figure 3.


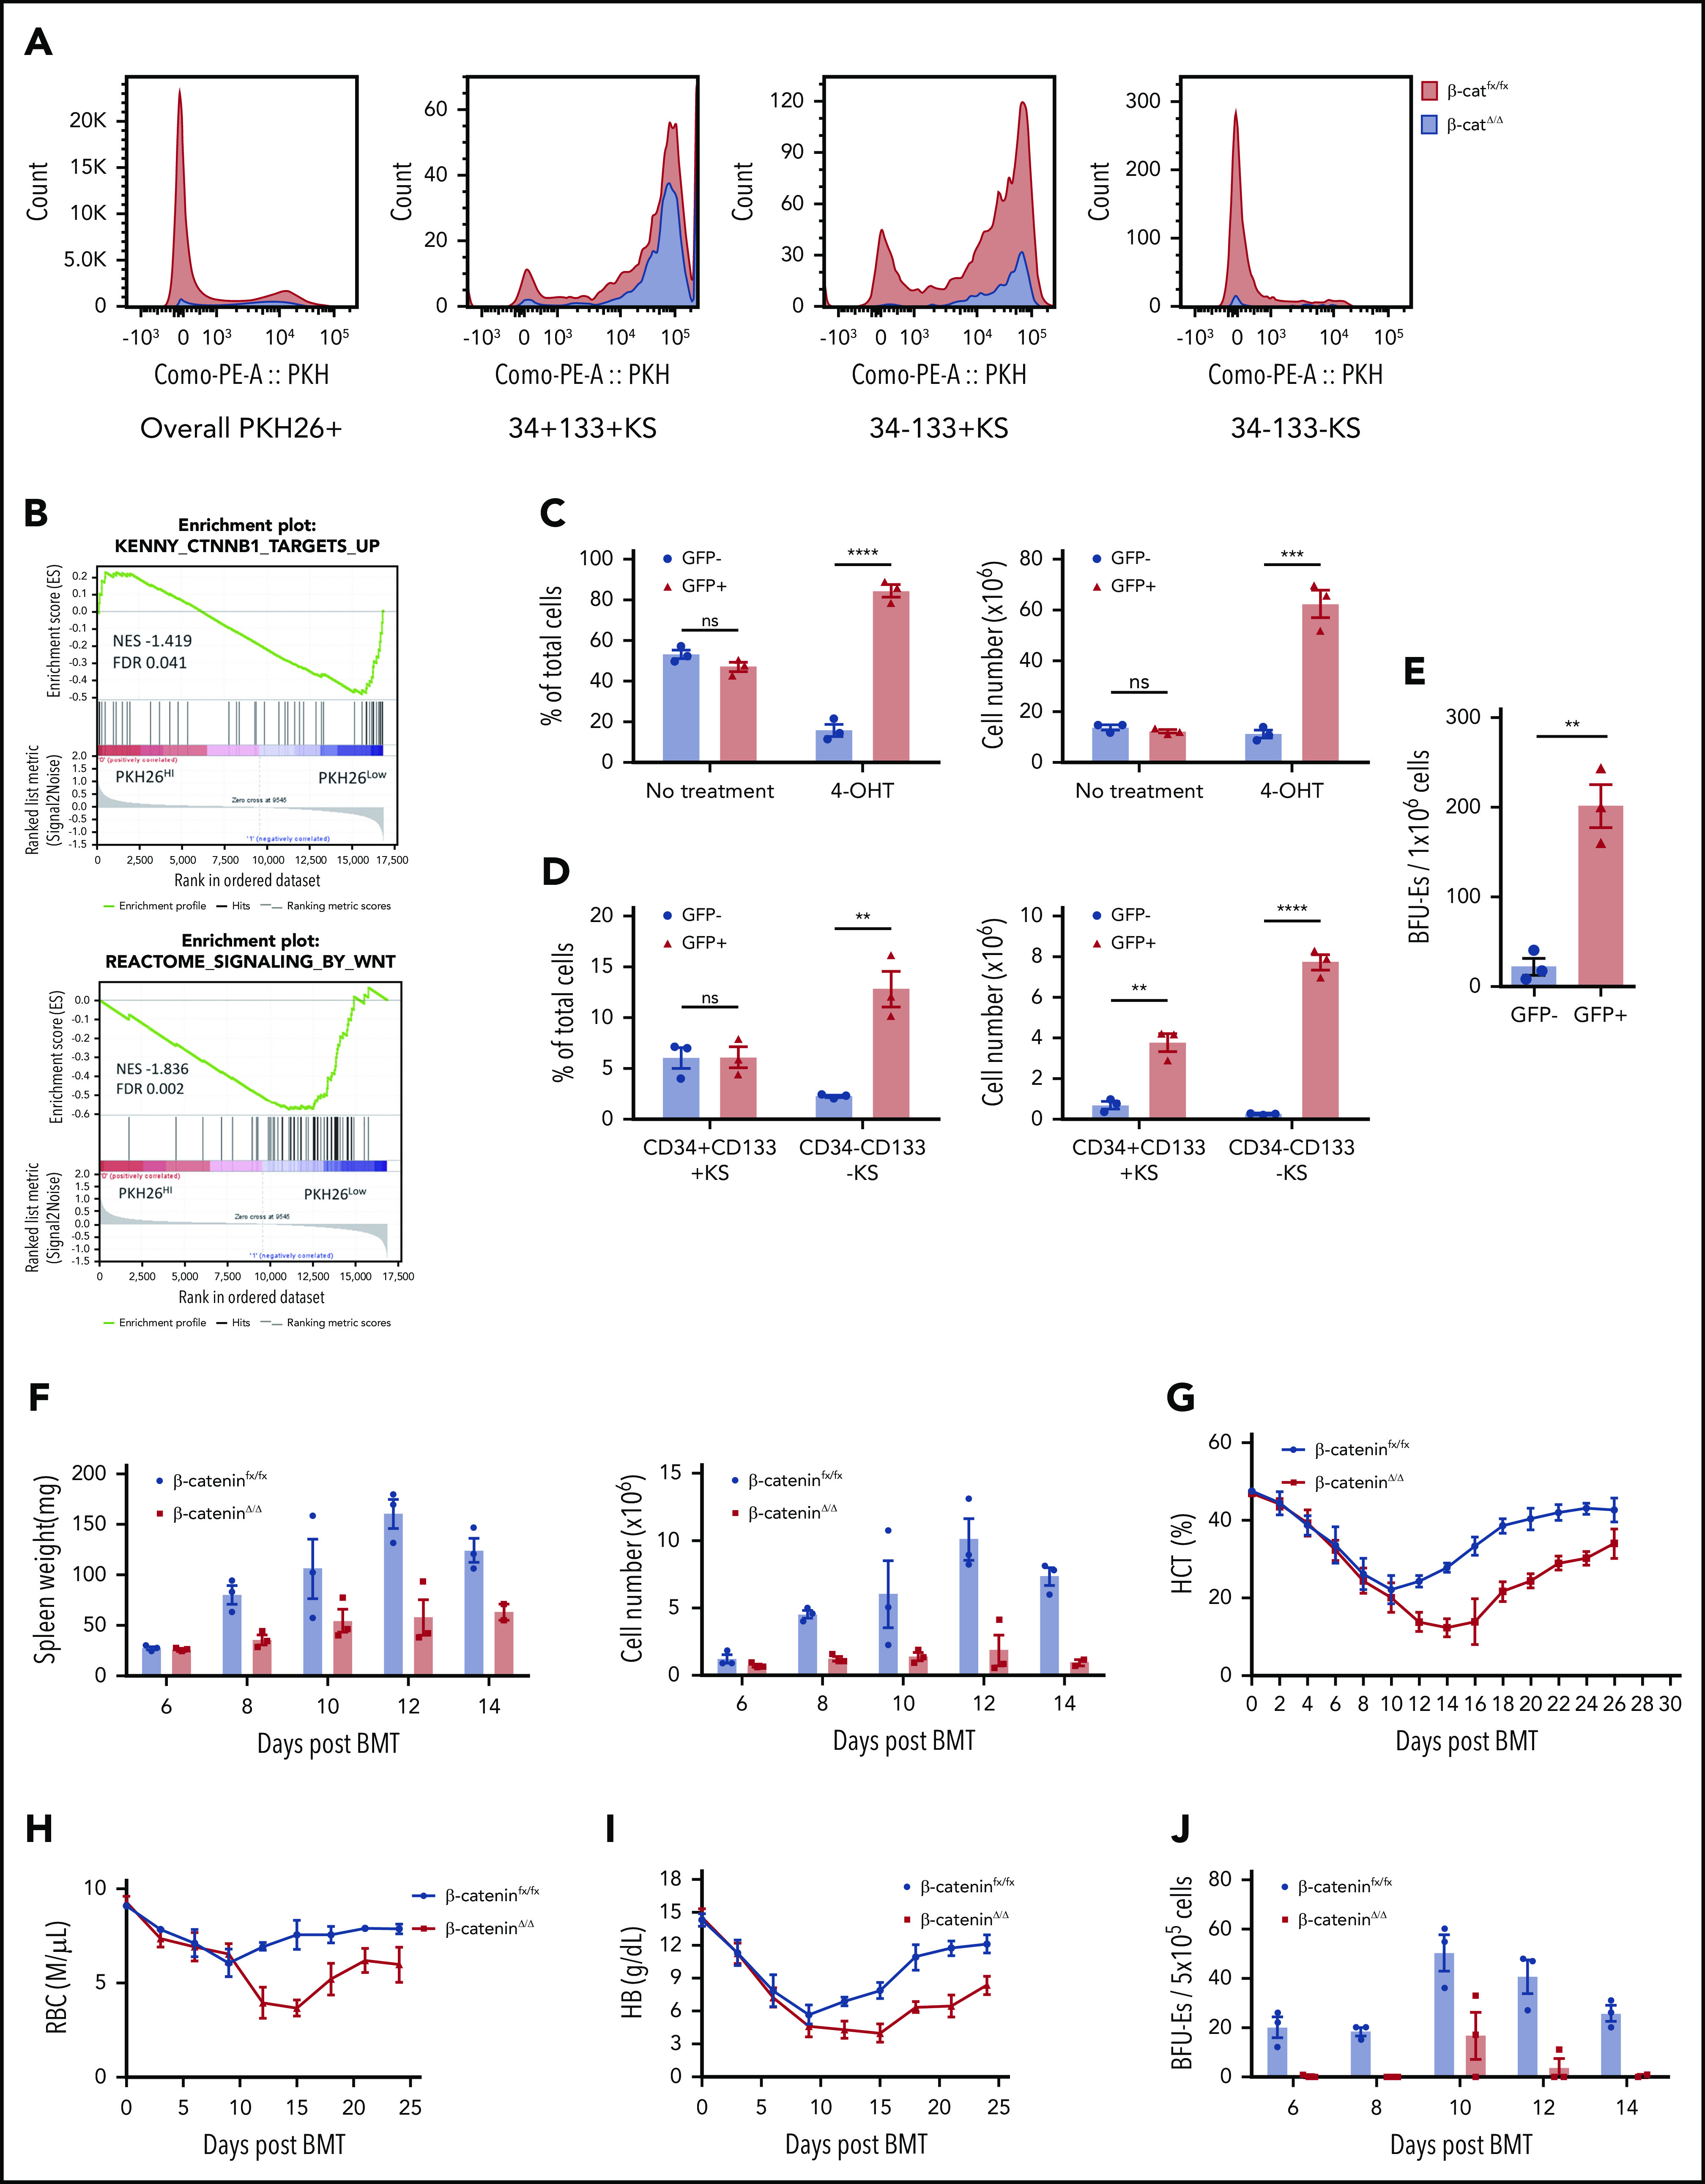
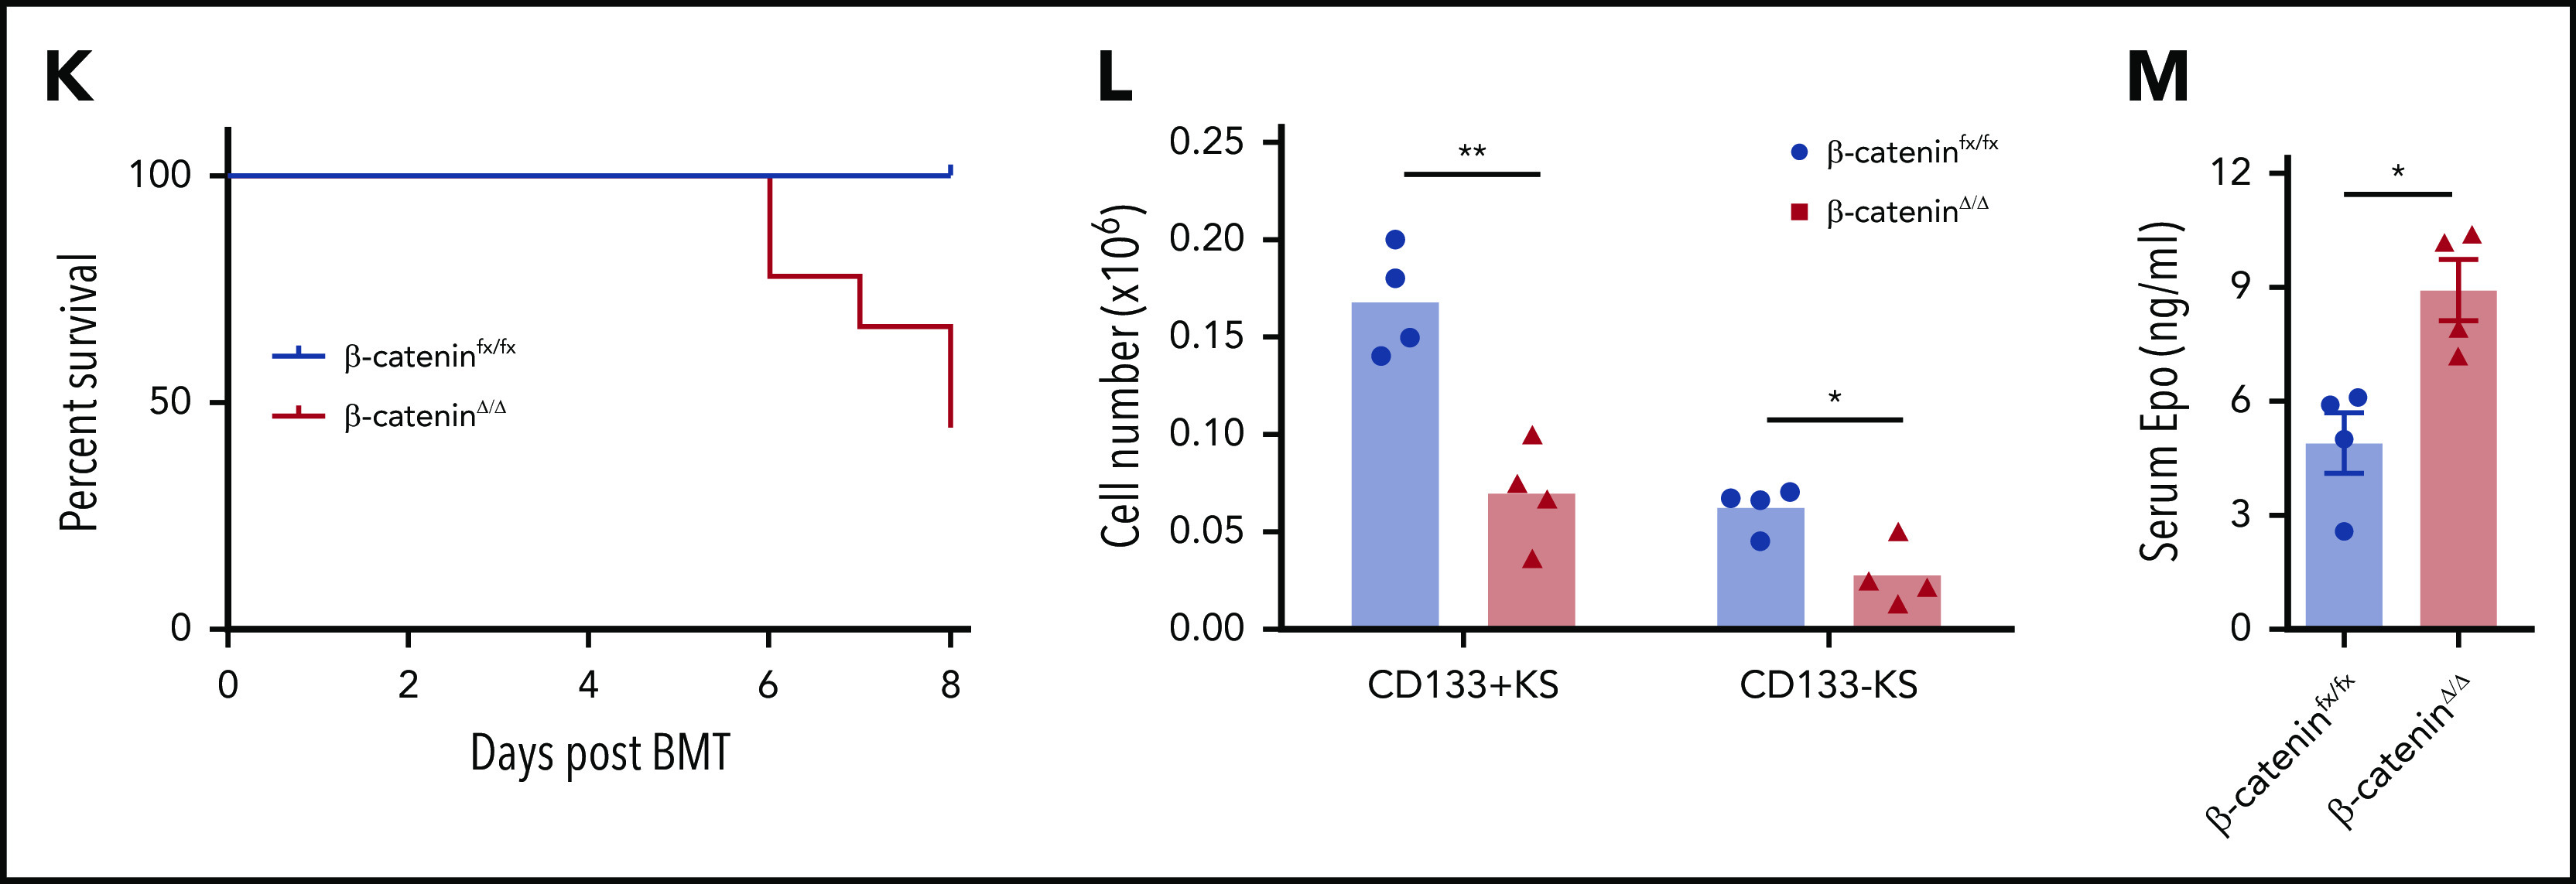
Macrophage-derived Wnt signaling regulates SEP proliferation through β-catenin–dependent signaling pathway. (A) Analysis of SEP proliferation using loss of PKH26 fluorescent intensity in control β-cateninfx/fx and β-cateninΔ/Δ bone marrow cells cultured in SEEM. Cells were labeled with PKH26 after isolation and cultured in SEEM for 5 days before analysis. Representative PKH26 fluorescence is shown for all cell populations (left), CD34+CD133+KS (second), CD34–CD133+KS (third), and CD34–CD133–KS (right). (B) Analysis of microarray data by gene set enrichment analysis (GSEA). Expression data from our previous microarray analysis comparing PKH26loCD133–Kit+Sca1+ (PKH26low) and PKH26hiCD133+Kit+Sca1+ (PKH26high) SEPs (National Center for Biotechnology Information Gene Expression Omnibus accession number, GSE122390). Normalized data sets were processed by using GSEA to determine statistically differentially expressed gene sets in the 2 groups of SEPs. Hallmark gene sets were accessed from the Molecular Signatures Database. Targets upregulated by β-catenin (top) and reactome signaling by Wnt (bottom). (C) β-cateninfx/fx;Rosa26-CreERT bone marrow cells were cocultured with GFP+ control bone marrow cells (1:1 ratio) for 2 days and then treated with or without 4-OHT for 24 hours. The cells were then washed and plated in fresh SEEM without 4-OHT for 2 days. Proportion (left) and total cell number (right) of GFP+ population (control cells) vs GFP– population (β-cateninΔ/Δ cells) in coculture. (D) Flow cytometry analysis of 4-OHT treated cocultures as described in panel C. Proportion (left) and total cell number (right) of CD34+CD133+KS population (GFP+ or GFP–) and CD34–CD133–KS population (GFP+ or GFP–). (E) Production of stress BFU-Es by β-cateninΔ/Δ SEPs. Cocultures (as described in panel C) were switched into SEDM and cultured for 3 days, after which GFP+ cells and GFP– SEPs were isolated by fluorescence-activated cell sorting and plated for stress BFU-Es. (F-J) Analysis of erythroid short-term radioprotection after BMT with β-cateninΔ/Δ or control unfractionated donor bone marrow cells. In all, 500 000 bone marrow cells isolated from β-cateninfx/fx;Rosa-CreERT or β-cateninfx/fx control mice were treated with 4-OHT for 24 hours before being transplanted to lethally irradiated C57BL/6 recipient mice. (F) Analysis of spleen weight (left) and total spleen cell number (right). (G) Analysis of hematocrit during the recovery time. (H) Analysis of red blood cell (RBC) count. (I) Analysis of hemoglobin (HB) level. (J) Analysis of stress BFU-Es in the spleen on the indicated days after transplantation. For each time point, n = 3 mice per group. (K-M) Analysis of erythroid short-term radioprotection after BMT by sorted β-cateninΔ/Δ and control SEPs. In all, 50 000 GFP cells and 50 000 sorted CD133+KS cells isolated from β-cateninfx/fx or β-cateninΔ/Δ mice were transplanted to lethally irradiated CD45.1 C57BL/6 recipient mice. (K) Survival of recipients that received β-cateninfx/fx or β-cateninΔ/Δ CD133+KS cells (n = 9 mice per group). (L) Flow cytometry analysis of donor-derived GFP– SEPs in the spleen on day 8 after BMT. (M) Serum Epo level measurement by ELISA on day 8 after BMT. Student t test (2-tailed). Data represent means ± SEM. *P < .05; **P < .01; ***P < .001; ****P < .0001.
