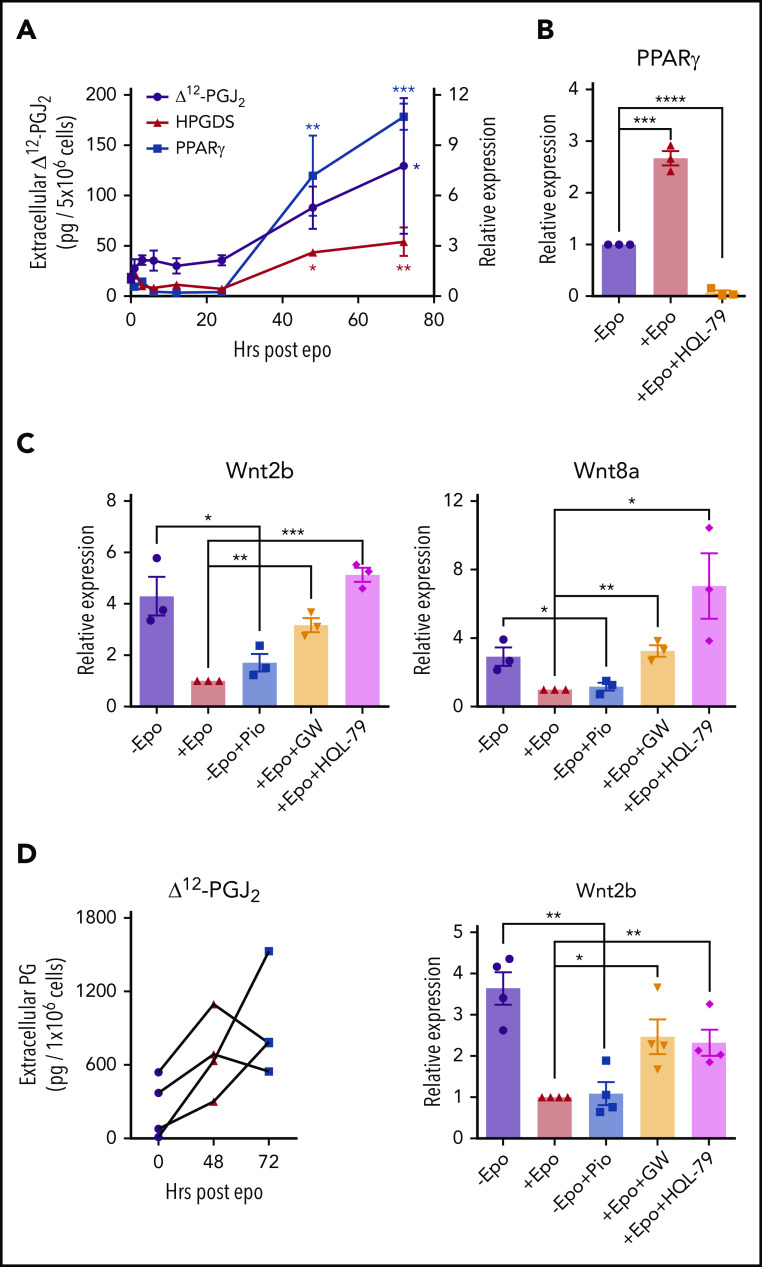
Figure 4.
Epo-dependent PPARγ signaling represses Wnt signaling. (A) mRNA expression of HPGDS and PPARγ (right y-axis) and liquid chromatography–tandem mass spectrometry (LC-MS/MS) analysis of extracellular Δ12-PGJ2 (left y-axis) of mouse BMDMs at indicated time points after Epo treatment. One-way analysis of variance (ANOVA) followed by Dunnett’s multiple comparisons. (*) Indicates P values for comparisons between indicated time points and 0 time point; (red *), HPGDS; (blue *), PPARγ; (black*), Δ12-PGJ2 (n = 3 per time point). (B) mRNA expression of PPARγ in mouse BMDMs treated with or without Epo or Epo plus 25 μM HQL-79 (HPGDS antagonist). (C) mRNA expression of Wnt2b (left) and Wnt8a (right) in mouse BMDMs treated with Epo, 1 μM pioglitazone (Pio; PPARγ agonist), 1 μM GW9662 (GW; PPARγ antagonist), or HQL-79, as indicated. (D) LC-MS/MS analysis of extracellular Δ12-PGJ2 of human BMDMs at the indicated time points before and after Epo treatment. Each set of points represents BMDMs derived from an independent donor (left). mRNA expression of Wnt2b in human BMDMs treated with Epo, Pio, GW, or HQL-79 as indicated (right). Student t test (2-tailed). Data represent means ± SEM. *P < .05; **P < .01; ***P < .001; ****P < .0001.

