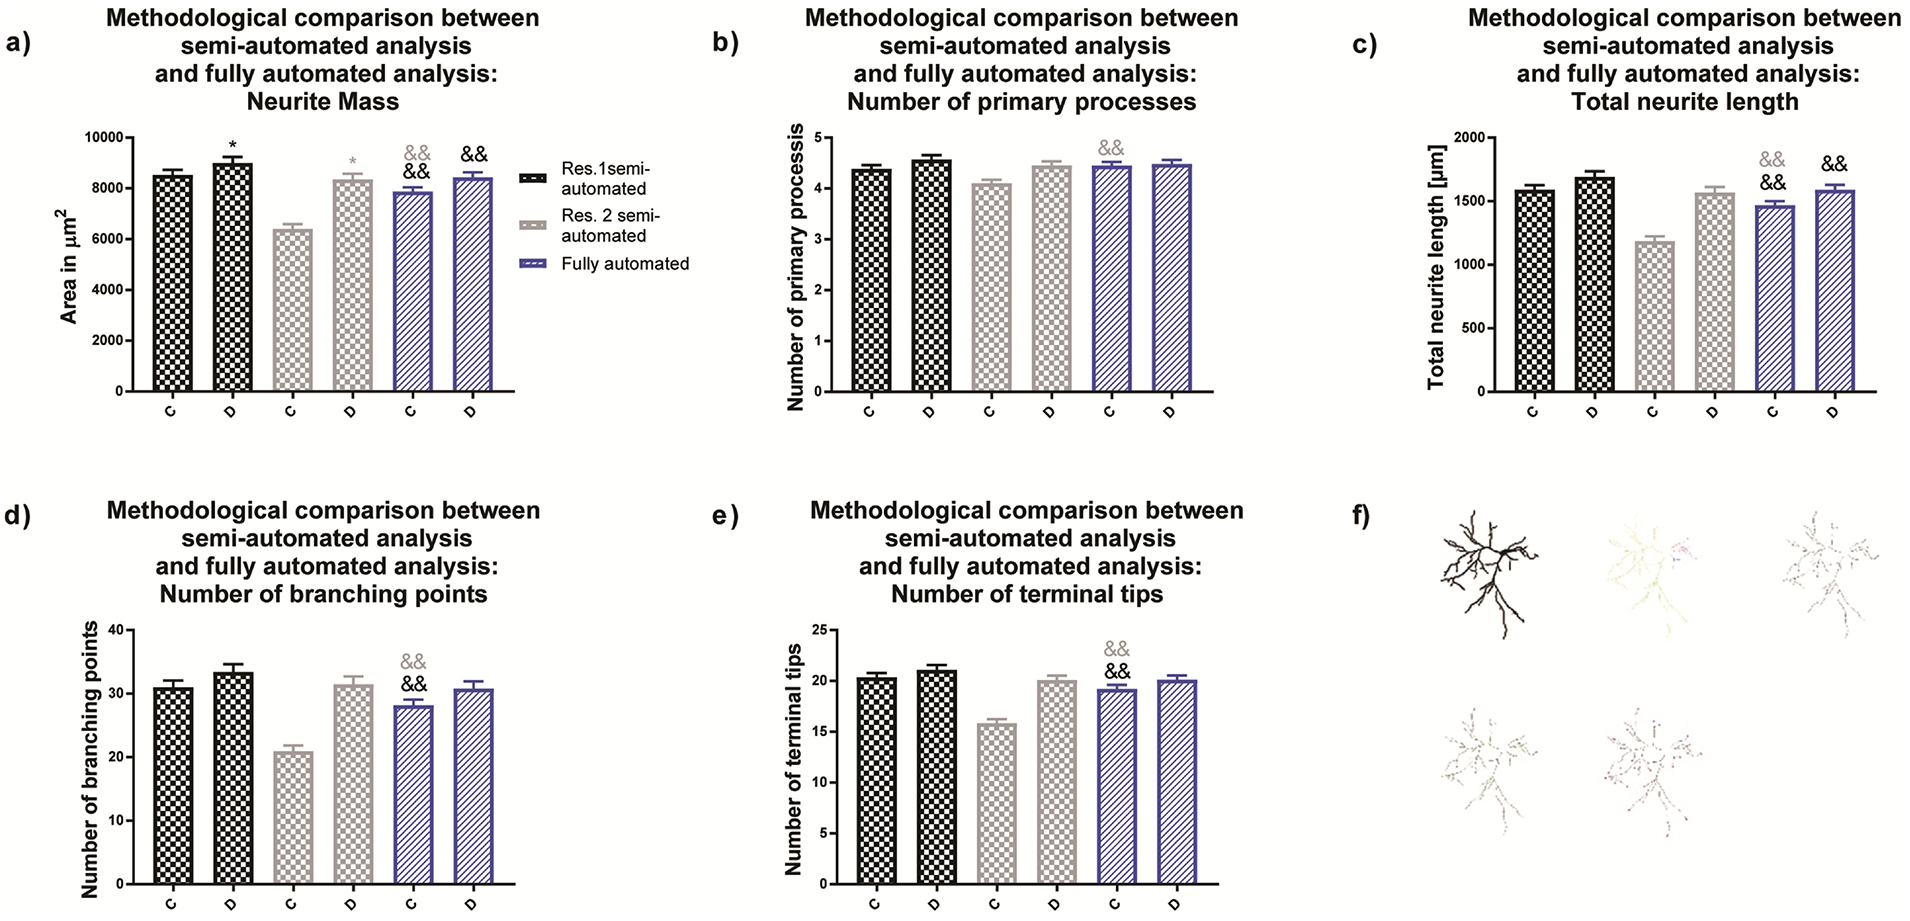
Figure 6. Morphological endpoints analyzed by the fully automated approach.

(a) Comparison of neural mass (area of the entire neuronal structure, (b) number of primary processes, (c) total dendritic length, (d) number of dendritic branch points and (e) number of terminal dendritic tips for primary rat cortical neurons obtained by (f) semi-automated and fully automated analysis. Data are shown as mean ± SEM (n=3 independent dissections per condition). *Significantly different (p<0.05) between experimental groups for the same researcher and && semi-automated method vs. fully automated method as determined using unpaired student’s t-test.
