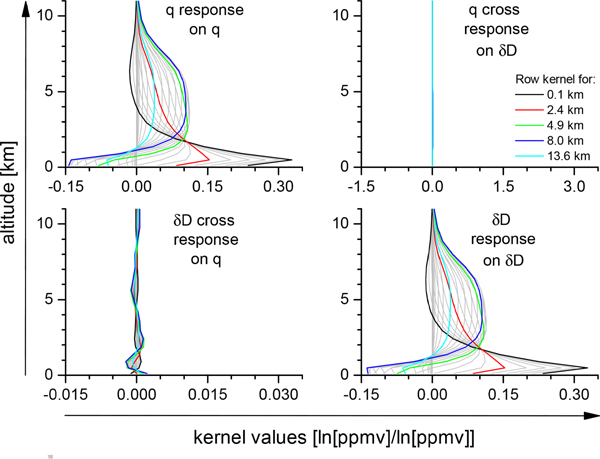
Figure 5.
Example of row entries of the Karlsruhe MUSICA NDACC/FTIR averaging kernels in the {q,δD} proxy basis system and after aposteriori correction. Please note that the q proxy kernels (upper left plot) and the δD proxy kernels (bottom right plot) are almost identical. The different scales on the x-axis consider the different magnitudes of ln[q] and δD variations. For more details please refer to Schneider et al. [2012] and Barthlott et al. [2016].

