Figure 1.
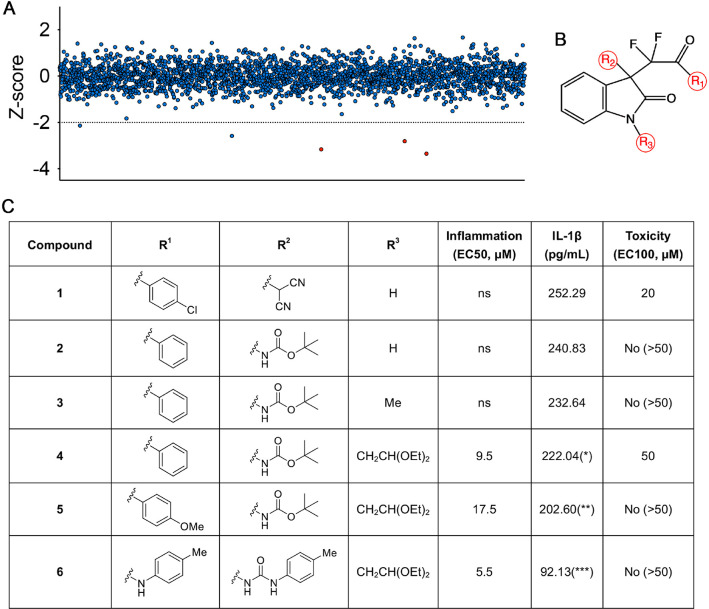
Screen and structural modification studies of pyroptosis-inhibiting compounds. (A) A graph showing results from the chemical screen in the J744A.1 cell line. Each point represents the calculated Z score of each compound on IL-1β releasing phenotype (a negative Z score represents active compounds). The dotted line marks the Z-score threshold of ≤ –2 that was applied to obtain primary hits in the hit window. Red data points indicated the primary hits which sharing the common backbone in B. (B) The C3-difluoroalkyl oxindole backbone for derivatization involving modifications at the 3 positions (red circles). (C) In vitro structure–activity relationship study and in vivo toxicity assessments of selected analogues. For anti-inflammation inhibition, the EC50 is the concentration of a compound that gives half-maximal response. The maximal response of the compound was presented as IL-1β concentration from immortalized murine macrophages. For nonspecific toxicity, the EC100 represents the concentration when 100% of the treated zebrafish embryos exhibit either early lethality, variable embryonic defects, or developmental delay. *P < 0.05, **P < 0.01, ***P < 0.001, and ****P < 0.0001. Compound concentrations and IL-1β data are means of ≥3 experimental replicates.

