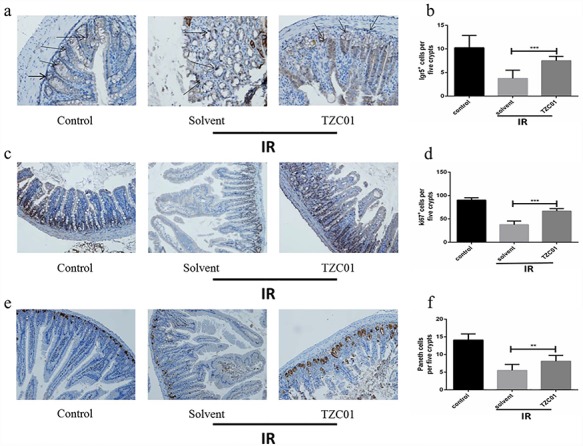
Fig. 4.

Radiation protection of TZC01. The small intestinal sections were analyzed by immunohistochemistry. (a) Photomicrograph of Lgr5 immunostaining section of Control, Solvent and TZC01 groups. (b) Histogram showing Lgr5-positive cells quantified in five crypts per section. (c) Immunostaining images showing quantitative analysis of Ki67 expression of intestinal crypts. (d) Histogram demonstrating Ki67-positive cells counted in five crypts per section. (e) Representative immunohistochemistry images for lysozyme-stained sections of small intestine. (f) Histogram showing the number of paneth cells per five crypts. The results are represented as mean ± SD, n = 5 mice per group. **P<0.01. ***P<0.005, using Tukey’s test.
