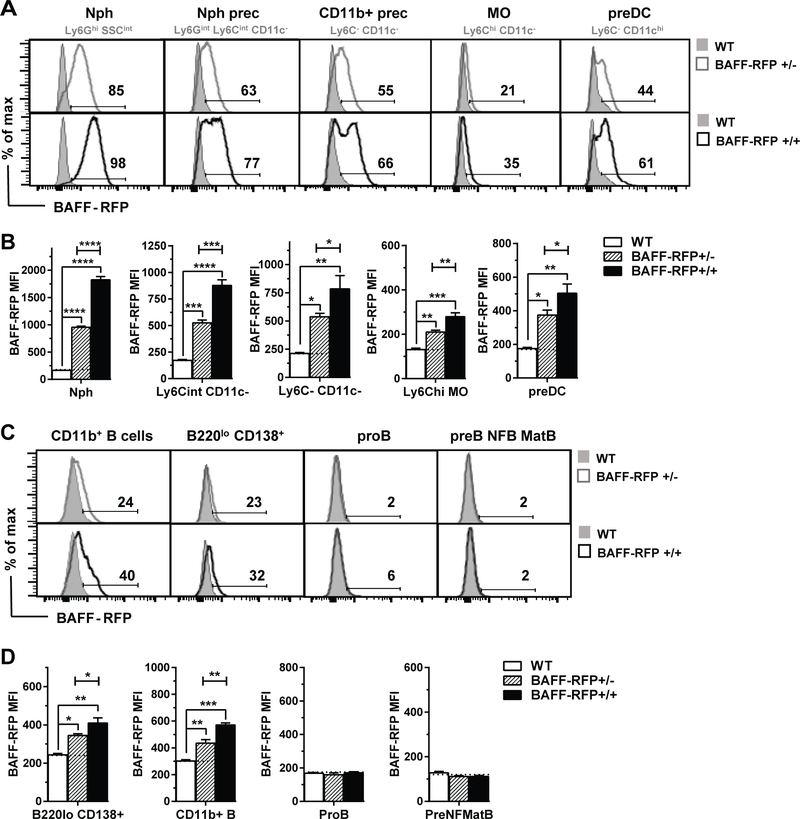
Figure 2. BAFF-RFP detection in BM cell populations.
A-D, BAFF-RFP detected by flow cytometry in BM myeloid cell populations (A-B) or B cell populations (C-D) from naïve WT mice, BAFF-RFP+/− mice and BAFF-RFP+/+ mice. For gating strategy of myeloid cell populations (A and B) in BM see Fig. S2B. For gating strategy of B cell populations (C and D) see Methods. Data shown are representative histograms (A and C) or mean ± SEM of RFP MFI (B and D) from one of two independent experiments performed with three mice per group each. B and D, dotted lines show RFP MFI background in WT control. Statistics were performed by one-way ANOVA with Holm-Sidak method for multiple comparisons; * p<0.05, ** p<0.01, *** p<0.001, **** p<0.0001.

