Figure 9.
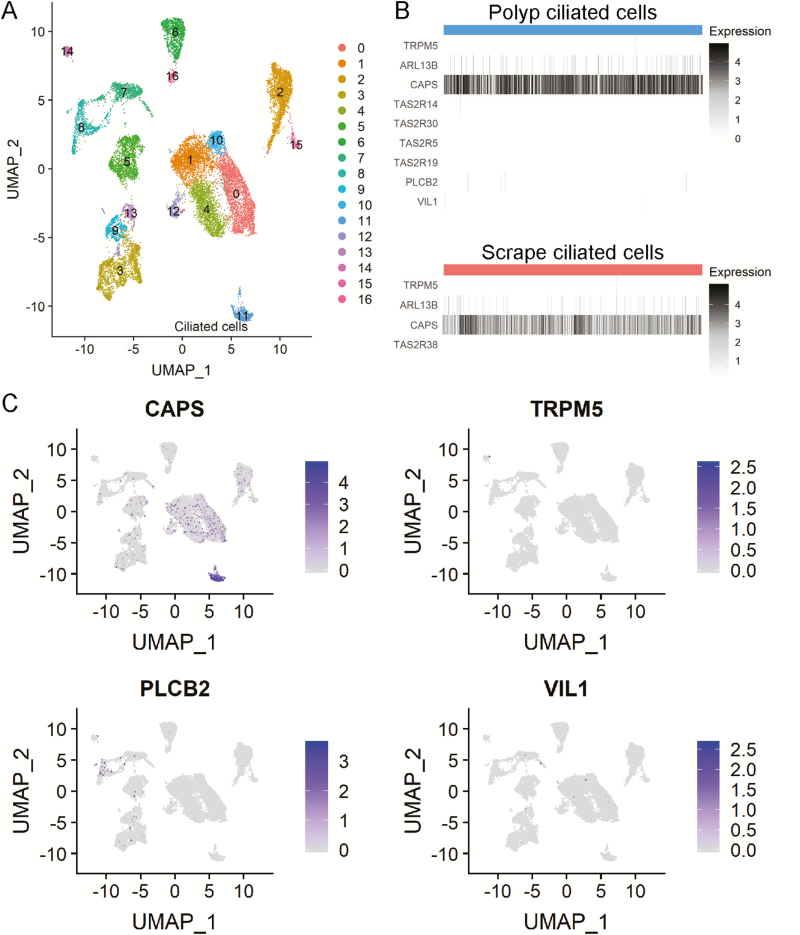
Secondary analysis of human nasal scRNAseq (Ordovas-Montanes et al. 2018, Supplementary Tables 2 [polyp] and 6 [epithelial scrapings]). (A) Raw counts of “polyp” data set were input to Seurat for filtering, normalization, and scaling. Clustering of 18,143 cells was determined using the K-nearest neighbor approach followed by the Louvain algorithm. Data are plotted after UMAP dimensionality reduction. Cluster 11 represents ciliated epithelial cells defined by expression of canonical ciliated cell markers including CAPS, FOXJ1, and TUBA1A. Other cell types identified include basal, apical, glandular, fibroblast, endothelial, plasma, T, myeloid, and mast based on top cluster markers, in accordance with the analyses of Ordovas-Montanes et al. (B) Heatmap of cells in ciliated cell cluster from both “polyp” and “scrape” data set showing expression of all nonzero TAS2R genes and canonical SCC markers TRPM5, VIL1, and PLCB2. Although few cells had some detectable levels of these markers, there was no overlapping expression of these markers within cells. (C) Overlap of UMAP plot showing expression of CAPS, TRPM5, PLCB2, and VIL1.

