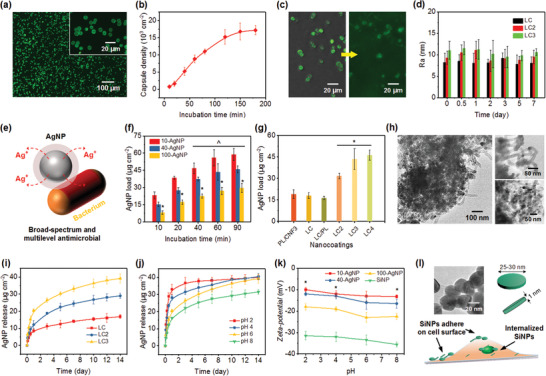
Figure 3.

a) CLSM images of LC3 shelled CaCO3 particles with incubation time of 120 min in particle suspension. PL used in the shells is labeled with FITC. b) Assembly of microcages as a function of incubation time in particle suspension (8 × 10⁶ particles mL−1). c) CLSM images of LC3 microcages (left) before and (right) after CaCO3 decomposition. d) Surface roughness of the PL/CNF films after immersion in PBS with different durations. e) Schematic showing the general mechanism for the antimicrobial action of AgNPs via the release of Ag+ ions. f) Loading of AgNPs with various sizes using LC3 microcages with increasing incubation time. g) Loading capability of various PL/CNF assembled carriers using 40 nm AgNPs for 60 min. *p < 0.01 compared to PL/CNF3, LC, and LC/PL coatings. h) TEM images showing the LC3 microcages after 40‐AgNP loading. The top right and bottom right images show the shell structure and internal structure of the microcages, respectively. Cumulative release profiles of 40 nm AgNPs i) from various microcages under pH of 6 and j) from LC3 microcages under various pH values in PBS solution. k) Zeta‐potential of AgNPs and SiNPs under different pH values. l) Top left: TEM image of SiNPs. Top right: The shape and dimension of SiNPs. Bottom: Schematic showing the approach of SiNPs to promote osteogenic differentiation.
