Figure 1:
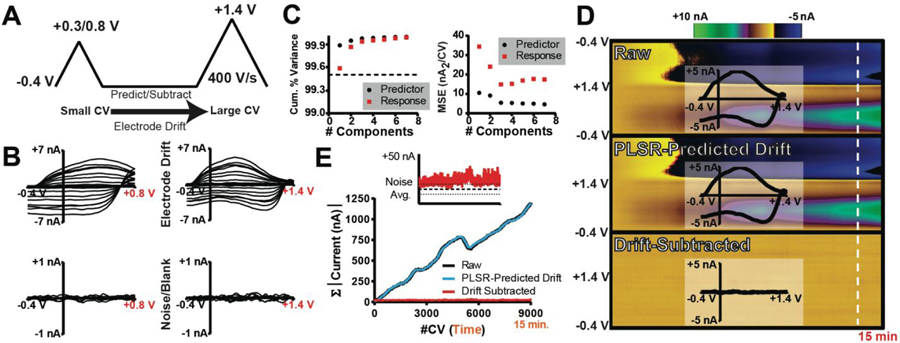
Introduction to the double-waveform partial-least-squares regression (DW-PLSR) paradigm. (A) Double waveform comprised of a smaller triangular sweep (sWF) paired with a larger sweep (lWF). (B) Training set CVs describing drift (top; 8 CVs) and noise (bottom; 3 CVs) recorded on the sWF (left) and the lWF (right). (C) 5-fold cross validation average mean-square error (left; nA2/CV) and cumulative percent variance (right) for both the predictor (black) and response (red). (D) Color plots displaying raw data collected with the lWF (top), PLSR-predicted drift (middle; three components), and drift-subtracted (bottom) data for a 15 min in vitro recording. Time and potential are plotted as the abscissa and ordinate, respectively. Current is depicted in false color, as indicated by the colorbar. Inset CVs were extracted from the data at the time point indicated by the white line. (E) Absolute current inherent to the CVs collected in the recordings displayed in (D), summed. Inset is a comparison of the total current in the drift-subtracted data to that in the training set describing the noise (bold black line is the mean; thinner lines represent the SD).

