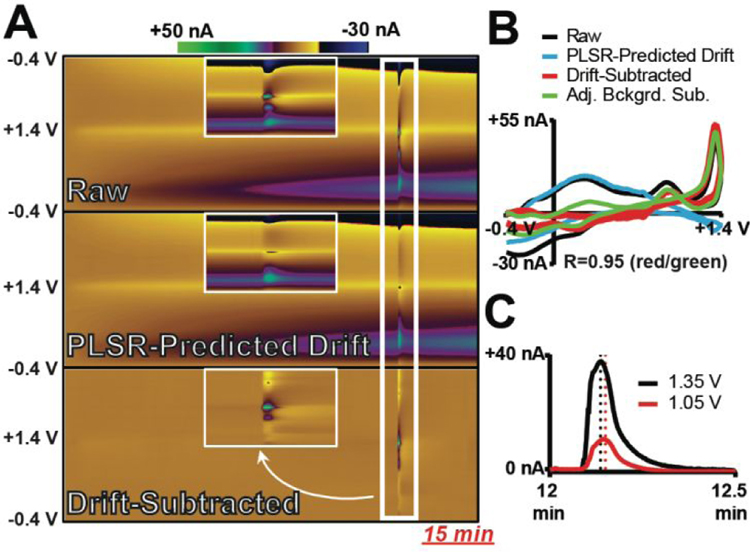
Figure 2:
DW-PLSR effectively removes drift from a 15 min recording containing a rapid fluctuation of adenosine (40 μM). (A) Color plots containing raw data collected with the lWF, PLSR-predicted drift (three components), and drift-subtracted data. Insets provide an expanded view of the adenosine fluctuation (white box). (B) CVs extracted at the time point of the adenosine injection. The CV generated using DW-PLSR for drift subtraction (red) correlates well with that generated using the conventional background-subtraction approach (green, R=0.95). (C) Current versus time traces extracted at the potential corresponding to the primary (+1.35 V; black) and secondary (+1.05 V; red) oxidation of adenosine.

