Figure 5:
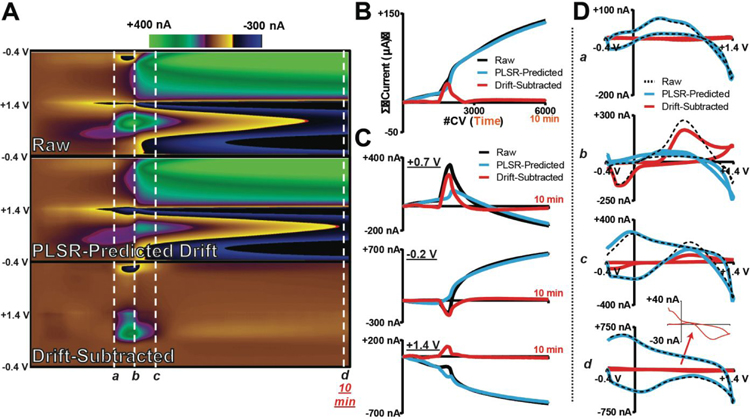
The DW-PLSR model removes drift from voltammetric data collected in the ventral striatum of an anesthetized rat during a 10-min ischemic event. (A) Raw data, PLSR-predicted drift (3 components), and drift-subtracted color plots. (B) Total summed current of each CV collected over time in (A). (C) Current versus time traces extracted at +0.7 V (top), −0.2 V (middle), and +1.4 V (bottom) from each color plot. (D) CVs extracted from the color plots at the time points indicated by the white lines and lowercase letters (a–d). Inset is the re-scaled drift-subtracted CV (d).

