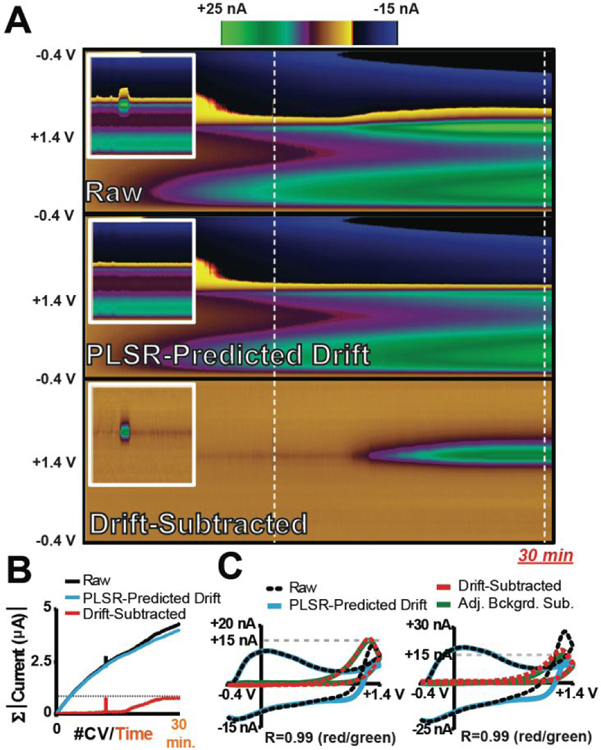
Figure 6:
A DW-PLSR model constructed using drift signals from a collection of electrodes reveals both transient fluctuations and gradual increases in H2O2 concentration. (A) Representative raw data, PLSR-predicted drift (seven components), and drift-subtracted color plots for a 30-min recording in which both a bolus injection and a gradual increase in H2O2 occurred (same concentrations; 160 μM shown). Insets show an enhanced view of the injection. (B) The summed current of each CV as a function of time for the color plots in (A). (C) CVs extracted (white lines in A) from the injection (a; top) and near the end of the gradual increase in H2O2 concentration (b; bottom). In both plots, a CV generated by subtracting a background signal collected immediately prior to the time of the injection is included for comparison (green).

