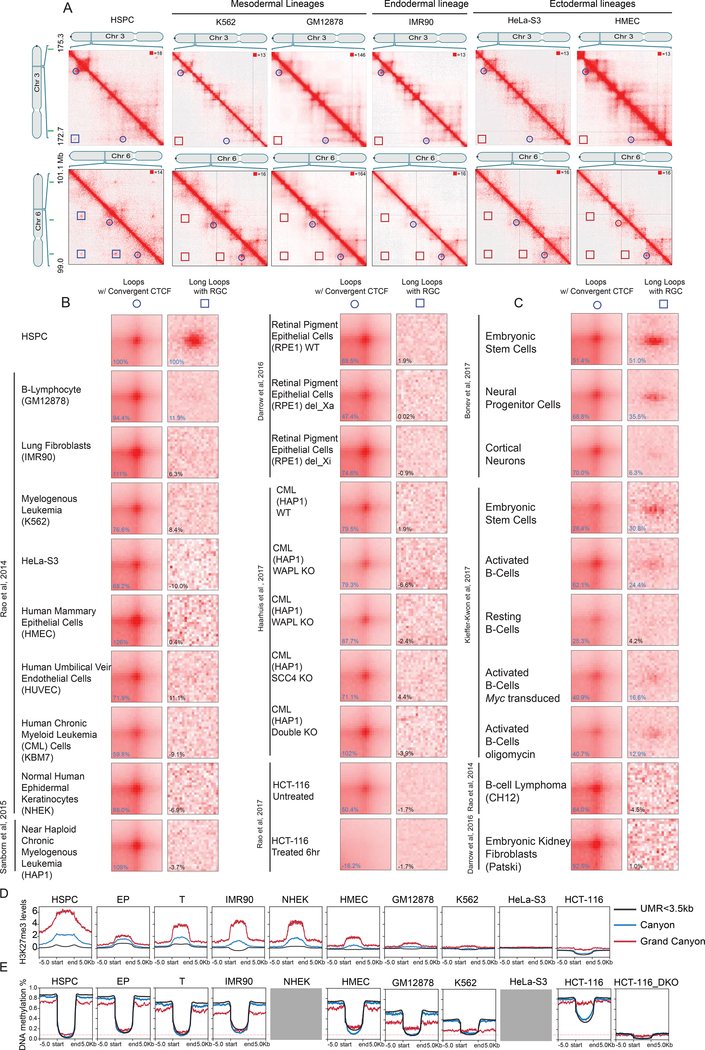
Figure 6. Canyon interactions are strongly enriched in undifferentiated cell types.
(A) Example of HiCCUPS loops (circles) and Long loops (squares) on chromosomes 3 and 6 across cell types (left). APA for loops with convergent CTCF and Long loops with repressive grand canyons across cell types (right). Canyons are indicated in green (top).
(B) APA on the indicated human cell types.
(C) APA on the indicated mouse cell types.
(D) Levels of H3K27me3 in the grand canyon, canyon, and UMRs<3,5kb in cells with both HiC data and H3K27me3 in B. (H3K27me3ChIP-input) FKPM value from deeptool 2.0 is shown on the y axis. H3K27me3 data is from ENCODE listed in STAR method.
(E) Levels of DNA methylation in the grand canyon, canyon, and UMRs<3,5kb in cells with both HiC data and WGBS data in B. DNA methylation level value is shown on the y axis. The red line indicates the methylation level of grand canyon in HSPC. Grey box indicates that the corresponding DNA methylation data is not available through ENCODE.

