
Extended Data Fig. 1. Optimization of microRaft arrays for stress granule quantification.
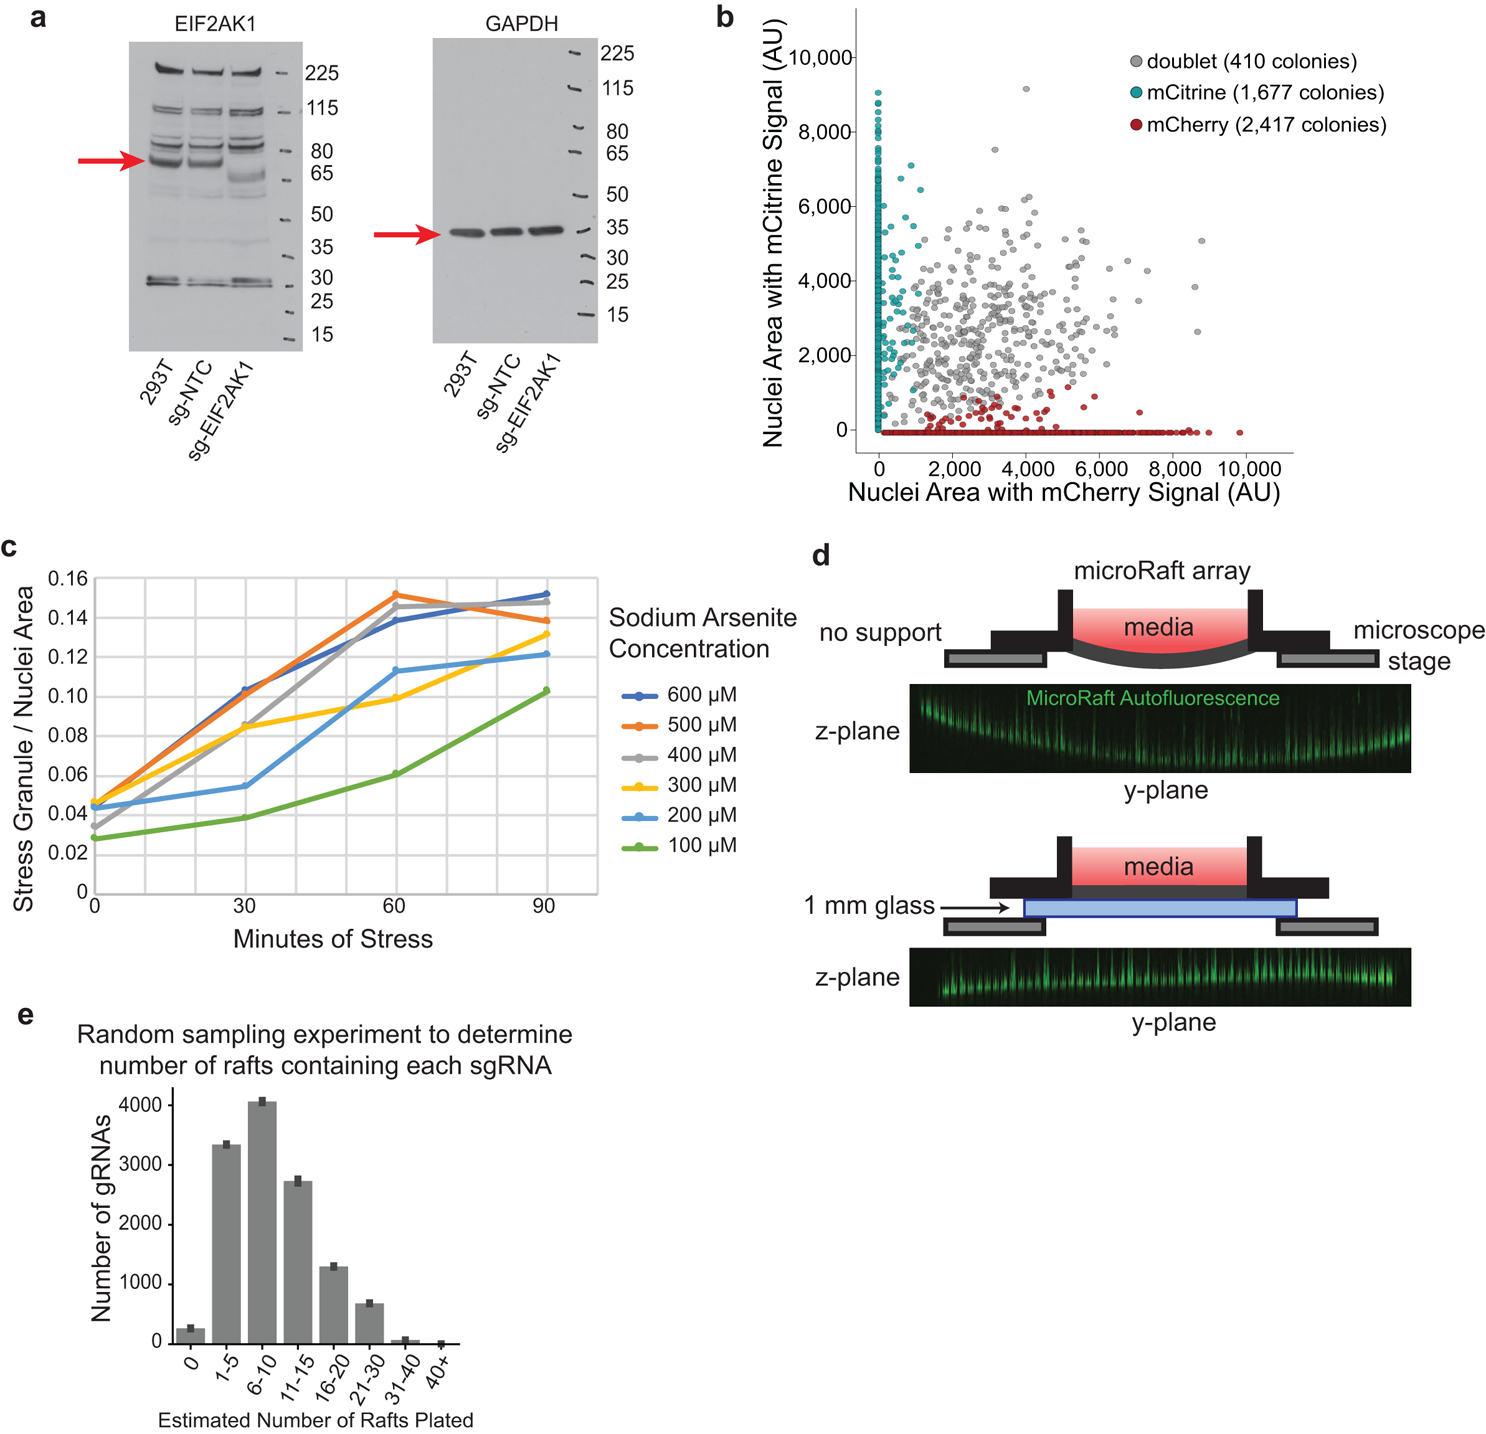
a, Uncropped Western blots measuring EIF2AK1 protein expression in cells infected with sg-NTC (nontargeting control), sg-EIF2AK1, or uninfected control cells (293T). (n = 1) b, Scatterplot of mCherry and mCitrine area measured in the nuclei of all colonies detected on a microRaft array. Colonies that contain fluorescent signal from both channels in more than 10% of the total nuclei area are determined as doublets (gray). c, Time-course analysis of stress granule formation in HEK293T cells under multiple sodium arsenite concentrations measured in 30-minute intervals. Stress granule area is quantified as G3BP1(+) cytoplasmic puncta across n = 1 image. d, Top, schematic of microRaft array without glass-back support. Orthogonal view of autofluorescence (green) in microRafts across PDMS array after imaging with high laser power. Bottom, diagram of microRaft array with 1 mm glass support with orthogonal view of autofluorescent microRafts after imaging with high laser power (green). e, Random sampling to estimate plating frequency of sgRNAs on rafts in this screen. Given the relative abundances of sgRNAs on day 7 and the total number of colonies plated (~120,000), random sampling was used to estimate the number of rafts that contain each sgRNA (x-axis), binned in counts of 5. Bars are the average of n = 10 random samplings with error bars displaying standard deviation.