
Extended Data Fig. 3. Library preparation scheme to sequence sgRNA infected in colonies.
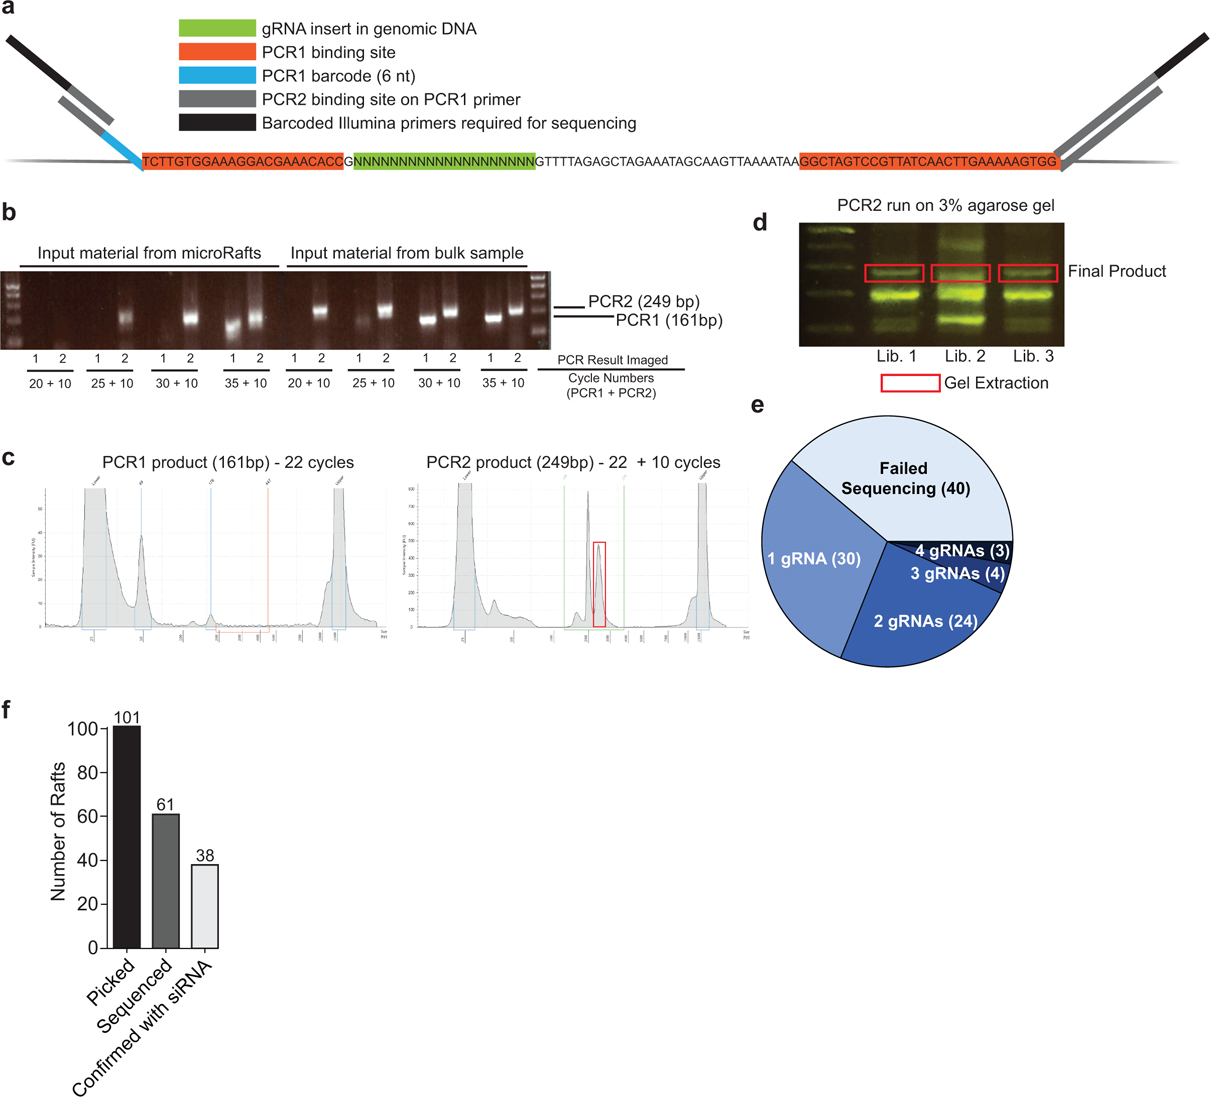
a, Schematic of PCR barcoding design targeting common regions flanking the sgRNA insert. b, Agarose gel of PCR products with increasing cycle numbers to determine the minimum number of PCR cycles required to amplify a product for sequencing. Input material from bulk sample is used as a positive control. All rafts sequenced in this study were amplified with 22 cycles for PCR1 and 10 cycles for PCR2 (n=213 total, 173 successful). c, TapeStation results of PCR products for one representative library containing four pooled microRafts. d, Agarose gel of PCR2 product for three representative libraries, each containing four pooled microRafts. Gel extraction was used to isolate the product of interest (red box) from a total of n = 32 libraries. e, Summary of the number of sgRNAs identified from each isolated cell colony. f, Bar chart of the total number of rafts picked, sequenced, and confirmed by siRNA depletion.