
Fig. 7:
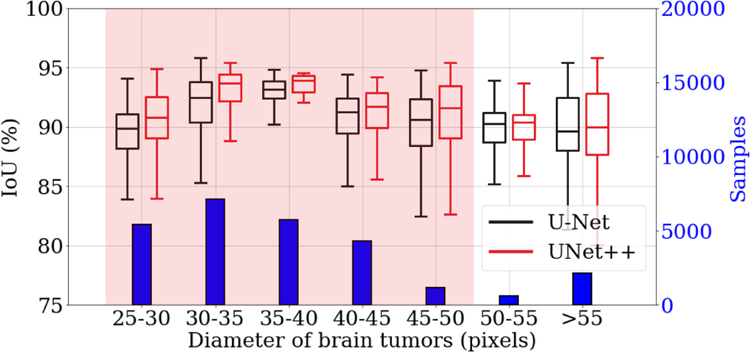
UNet++ can better segment tumors of various sizes than does U-Net. We measure the size of tumors based on the ground truth masks and then divide them into seven groups. The histogram shows the distribution of different tumor sizes. The box-plot compares the segmentation performances of U-Net (black) and UNet++ (red) in each group. The t-test for two independent samples has been further performed on each group. As seen, UNet++ improves segmentation for all sizes of tumors and the improvement is significant (p < 0.05) for the majority of the tumor sizes (highlighted in red).