Figure 1.

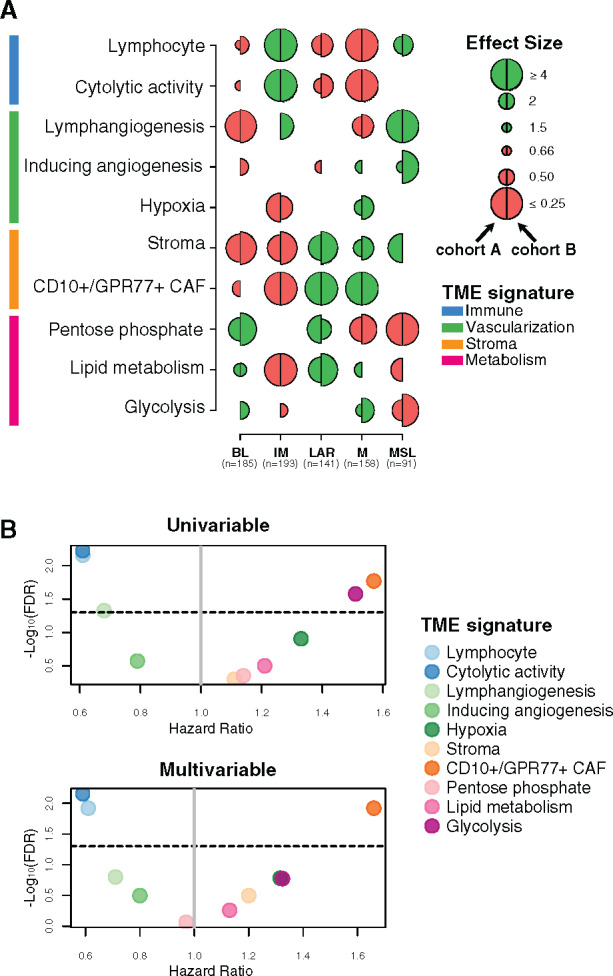
Tumor microenvironment (TME) features associated with triple-negative breast cancer (TNBC) molecular subtypes and overall survival (OS). A) Associations between TME gene expression signatures and TNBC molecular subtypes. A logistic regression model was used to evaluate associations between each specific gene signature and each TNBC molecular subtype. P values were obtained from parametric Mann-Whitney U tests and corrected for multi testing. Only statistically significant associations are shown (false discovery rate [FDR] ≤ .05), with negative and positive associations represented in red and green, respectively. The left half-circle and the right half-circle represent cohorts A and B, respectively. B) Associations between TME gene signatures and 10-year OS, using univariate and multivariable Cox regression models, adjusted for the dataset (The Cancer Genome Atlas Consortium vs Molecular Taxonomy of Breast Cancer International Consortium), patient age (≤40 y vs >40 y), nodal status (positive vs negative), tumor size (<2 cm vs ≥2 cm), and histological grade (I/II vs III). The x- and y-axis represent the hazard ratio and the −log10 (FDR), respectively. The horizontal bold dotted line represents the FDR threshold at .05 for statistically significant associations. BL = Basal-like; CAF = Cancer-associated fibroblast; IM = Immunomodulatory; LAR = Luminal androgen receptor; M = Mesenchymal; MSL = Mesenchymal stem-like.
