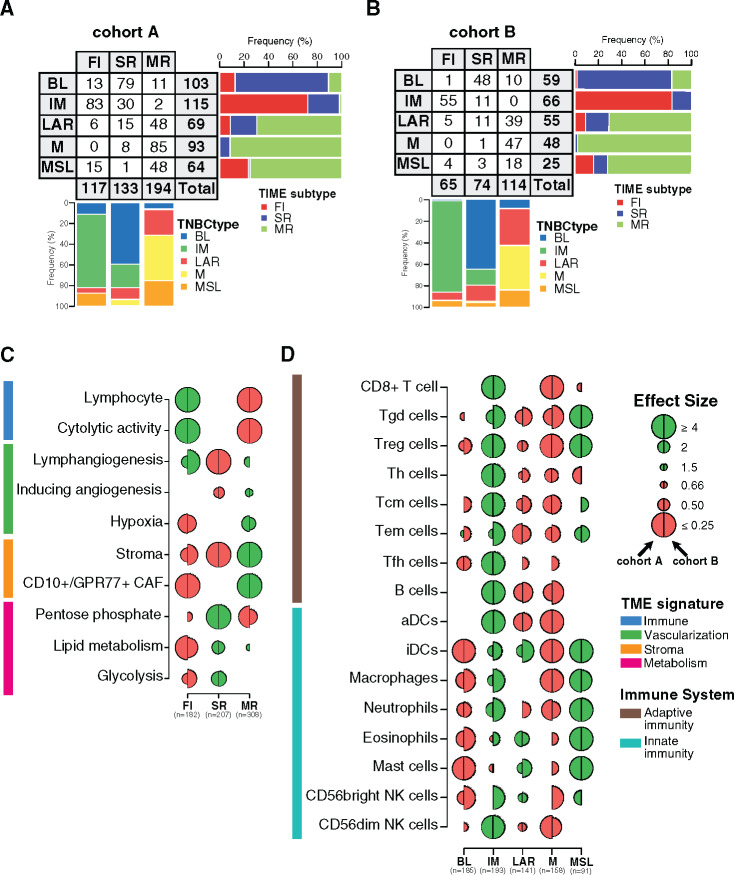
Figure 2.
Characterization of the spatial immune landscape and immune composition in triple-negative breast cancer (TNBC) molecular subtypes. Associations between TNBC molecular subtypes and tumor immune microenvironment (TIME) subtypes in cohorts A (A) and B (B). C) Associations between tumor microenvironment (TME) gene expression signatures and TIME subtypes. Logistic regression model was used to evaluate the association between each feature and each subtype. D) Associations between 16 immune cell subsets scores with TNBC molecular subtypes. A logistic regression model was used to evaluate associations between each immune cell population and each tumor TNBC molecular subtype. P values were obtained from parametric Mann-Whitney U tests and corrected for multi testing. Only statistically significant associations are shown (FDR ≤ .05), with negative and positive associations represented in red and green, respectively. The left half-circle and the right half-circle represent cohorts A and B, respectively. aDC = Activated dendritic cells; B cell = B cell lymphocytes; BL = Basal-like; CAF = Cancer-associated fibroblast; FI = Fully-inflammed; iDC = Inactivated dendritic cells; IM = Immunomodulatory; LAR = Luminal androgen receptor; M = Mesenchymal; MR = Margin restricted; MSL = Mesenchymal stem-like; NK = Natural killer cells; SR = Stroma restricted; Tcm = Central memory T cells; Tem = Effector memory T cells; Tfh = Follicular helper T cells; Th = Helper T cells; Treg = Regulatory T cells.

