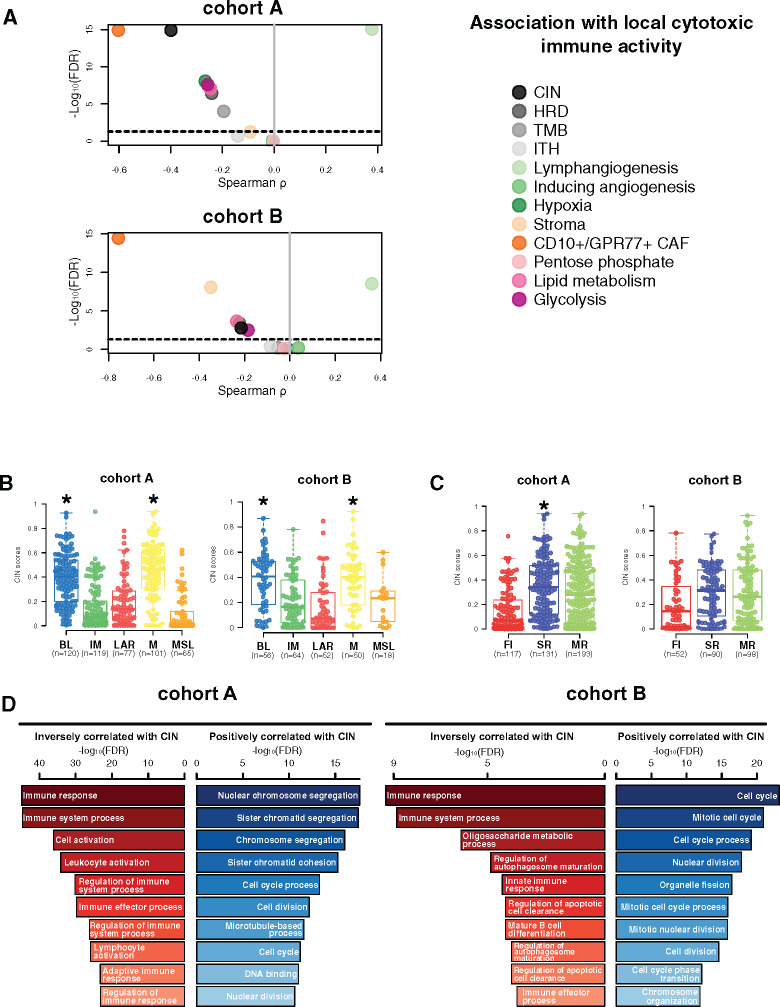
Figure 3.
Chromosomal instability association with immune escape. A) Associations between tumor microenvironment (TME) and tumor-specific features with local cytotoxic immune activity (CYT) in cohorts A and B. Spearman correlation was used to evaluate associations between each TME and tumor-specific gene expression signature with the CYT gene signature. The x- and y-axis represent Spearman ρ and the −log10(FDR), respectively. The horizontal bold dotted line represents the FDR threshold at 0.05 for statistically significant association. Chromosomal instability (CIN) distribution within each triple-negative breast cancer (TNBC) molecular (B) and tumor immune microenvironment (TIME) (C) subtype in cohorts A and B. Differences between each subtype and the rest of the cohort were assessed using a two-sided Mann-Whitney U test. A black star was displayed when statistically significant CIN score enrichment was observed within a specific TNBC and TIME subtype. D) Gene ontology analyses of genes with mRNA expression statistically significant (FDR ≤ .05) negatively (left, in red) and positively (right, in blue) correlated with CIN scores (Spearman correlation) in cohorts A and B. BL = Basal-like; CAF = Cancer-associated fibroblast; CIN = Chromosomal instability; FI = Fully-inflammed; HRD = Homologous recombination deficiency; IM = Immunomodulatory; ITH = Intra-tumoral heterogeneity; LAR = Luminal androgen receptor; M = Mesenchymal; MR = Margin restricted; MSL = Mesenchymal stem-like; SR = Stroma restricted; TMB = Tumor mutational burden.

