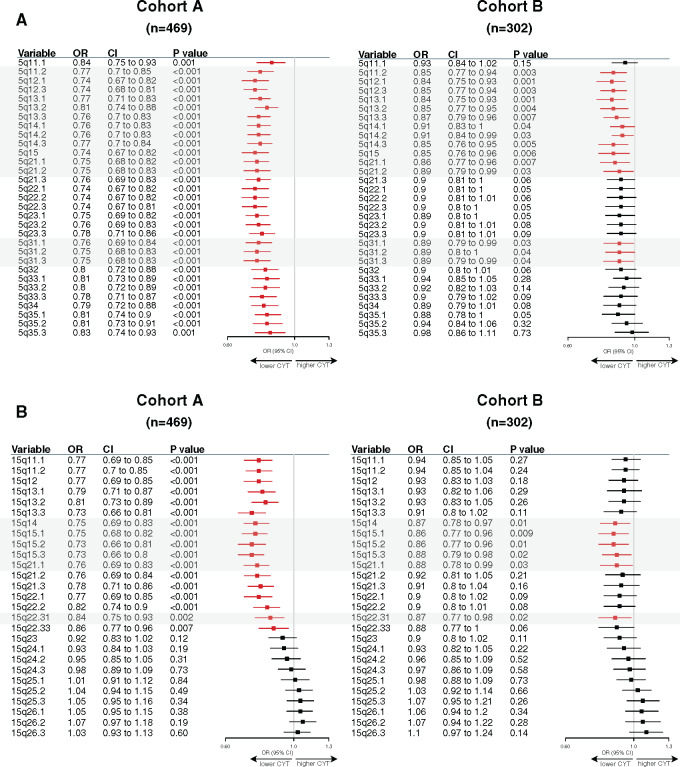
Figure 5.
Specific 5q and 15q region losses associated with reduced cytotoxic immune activity (CYT). Associations between chromosome 5q (A) and 15q (B) specific region logR with cytotoxic activity using a linear regression model. Forestplots displaying hazard ratios and 95% confidence intervals (CI). Horizontal bars represent the 95% CI of odds ratios (OR). Variables with statistically significant effect (P ≤ .05) are shown in red. Gray boxes highlight common regions significantly associated in both cohorts.

