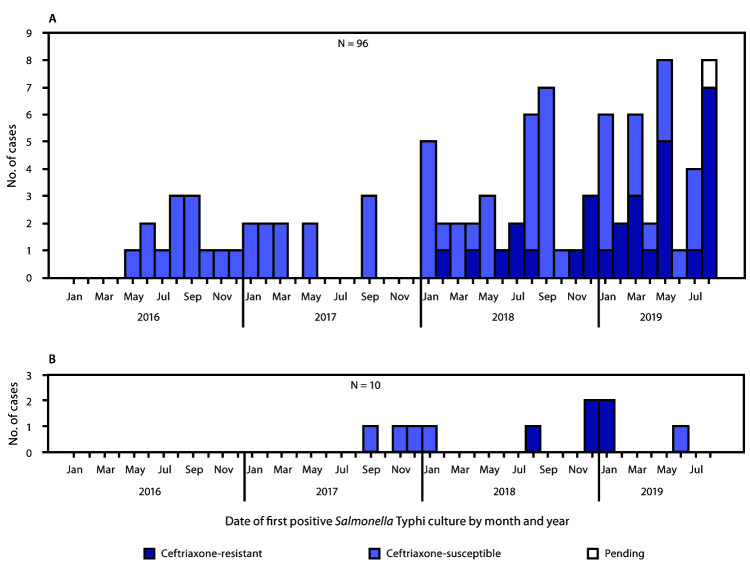
FIGURE 1.
Cases of culture-confirmed typhoid fever linked to travel to or from Pakistan (A) or Iraq* (B) by ceftriaxone susceptibility status and culture date (month/year) — United States,† January 1, 2016–August 31, 2019
* The patient whose case was diagnosed in November 2017 traveled to Iran only.
† Two patients whose cases were diagnosed in January 2019 were residents of the United Kingdom who became ill after travel to Iraq (panel B).

