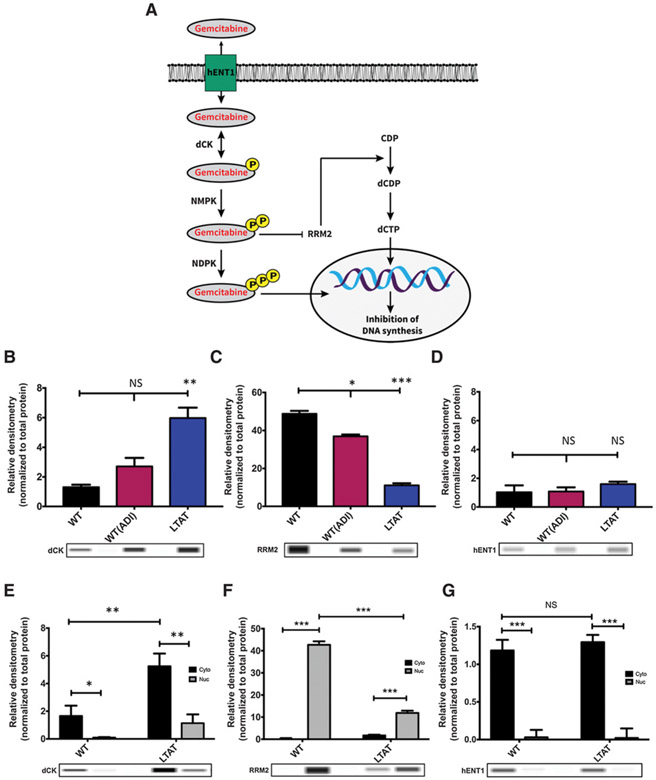
Figure 1.
ASS1 expression determines the efficacy of GEM and DTX therapies. A, Schematic diagram of the GEM pathway: arrows represent stimulation and T-bars represent inhibition. hENT1, human equilibrative transporter 1. dCK, deoxycytidine kinase; NMPK, nucleoside monophosphate kinase; NDPK, nucleoside diphosphate kinase; RRM2, ribonucleotide reductase; CDP, Cytidine diphosphate; dCDP, deoxycytidine diphosphate; dCTP, deoxycytidine triphosphate. B-D, Protein expression of main biomarkers in the GEM pathway were compared across SK-LMS-1 WT (−ADI) WT(+ADI) and LTAT cell lines. Protein extracts were analyzed by WES automated blotting system. Band density differences were expressed as relative densitometry normalized to the total protein in each capillary. E-G, Nuclear (Nuc) and cytoplasmic (Cyto) protein expression of main biomarkers in the GEM pathway were compared across SK-LMS-1 WT (−ADI) and LTAT cell lines. Protein extracts were analyzed by WES automated blotting system. Band density differences were expressed as relative densitometry normalized to the total protein in each capillary. Data are from 3 independent experiments. *, P < 0.05; **, P < 0.01; ***, P < 0.001.

