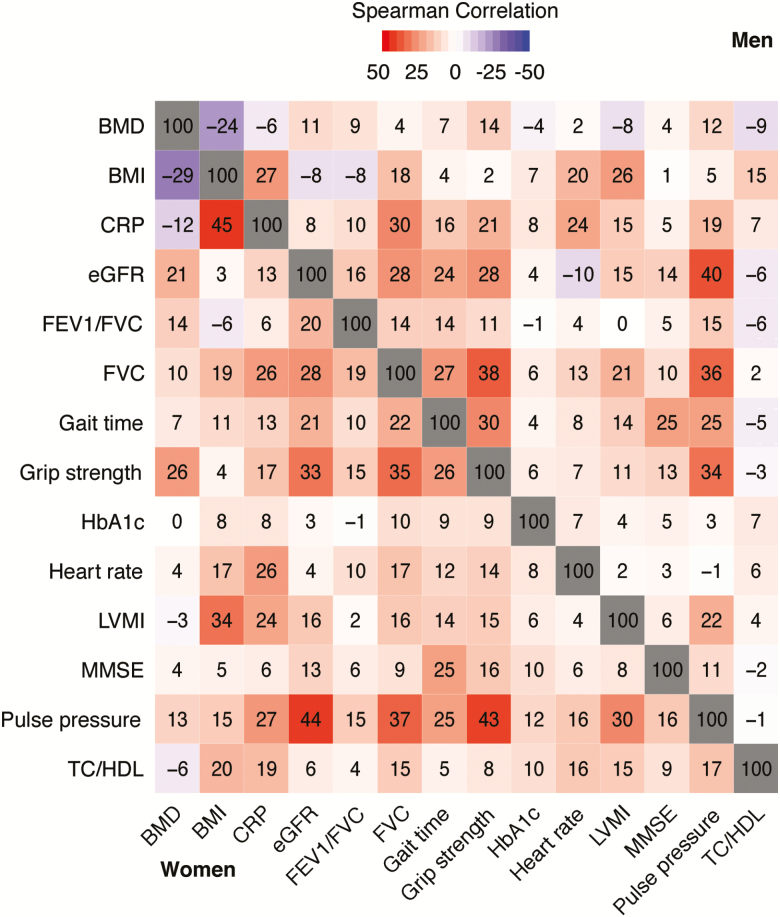
Figure 3.
Correlations between biological system trajectory patterns by sex (n = 2,748). Numbers represent Spearman correlation coefficients × 100. BMD = Bone mineral density; BMI = Body mass index; CRP = C-reactive protein; eGFR = Estimated glomerular filtration rate; FEV1 = 1 Second forced expiratory volume; FVC = Forced vital capacity; HbA1c = Glycated hemoglobin; LVMI = Left ventricular mass index; MMSE = Mini-Mental State Examination; TC = total cholesterol; HDL = High-density lipoprotein cholesterol.

