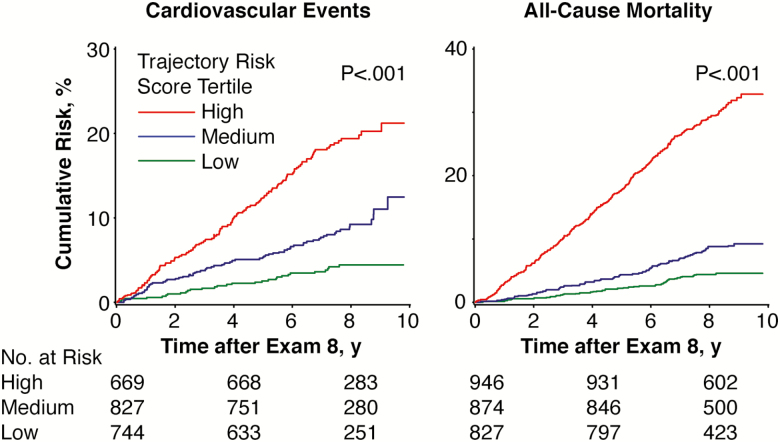
Figure 6.
Cumulative incidence of All-cause mortality and cardiovascular disease events after examination eight by tertiles of the corresponding biological system trajectory risk scores (n = 2,270 for cardiovascular events and n = 2,748 for mortality). The lines represent unadjusted cumulative incidence function curves. Log-rank p < .001 for all 10 imputed datasets.

