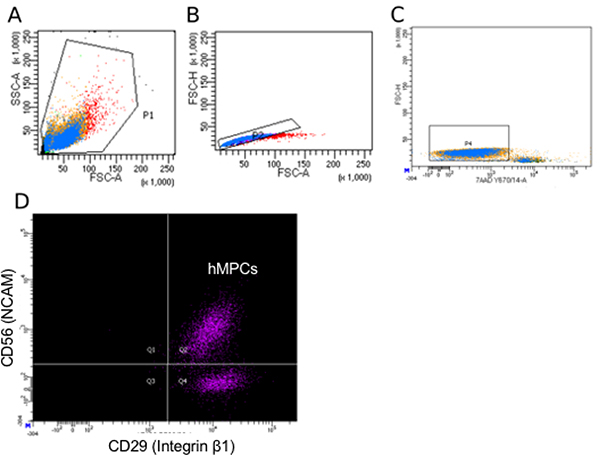
Figure 3: Representative flow cytometry sorting parameters for hMPC isolation.
(A) Side scatter area (y-axis) vs. forward scatter area (x-axis) gating strategy used to identify all cells in a donor sample. (B) Forward scatter height (y-axis) vs. forward scatter area (x-axis) to disqualify doublets from the sorting population. (C) Forward scatter height (y-axis) vs. 7-AAD incorporation to identify viable cells. (D) PE-Cy7 (CD56) vs. AF488 (CD29) staining with Q2 representing double positive cells (hMPCs). Color represents the density of events.

